Multimode Fabry-Perot cavity: Linear spectra and 2D polariton dynamics
Authors: Xinwei Ji, Tao E. Li
This tutorial provides the simplest demonstration of the following two papers:
TE Li. Mesoscale Molecular Simulations of Fabry–Pérot Vibrational Strong Coupling. J. Chem. Theory Comput. 20, 7016–7031 (2024).
Xinwei Ji, Tao E. Li. Nonlinear Freezing of Vibrational Polariton Transport via Mesoscale Simulations. arXiv:2606.27463 (2026).
This tutorial uses the MultiModeSimulation solver with many non-socket SHO drivers. The setup follows the simple 1D Fabry-Perot cavity parameters introduced in JCTC 20, 7016–7031 (2024): 144 photon modes, 144 molecular grid points, omega_perp = 2320 cm^-1, and delta_omega_x = 12.5 cm^-1.

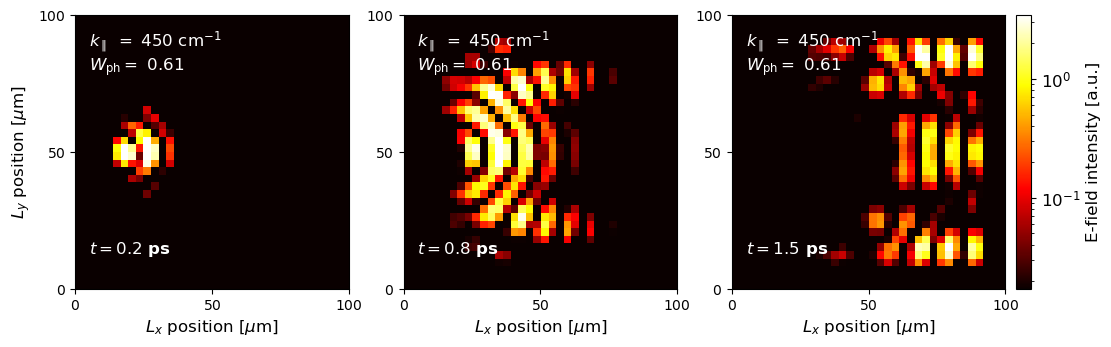
The final part of this tutorial will try to simulate 2D polariton dynamics following the above setup.
1. 1D simulation with SHO model
The 144 molecular grid points are placed uniformly along the 1D cavity mirror plane. Each grid point carries one SHO driver in this toy example.
The SHO dipoles are oriented along y, because the 1D cavity mode functions couple to the y polarization only in this specific cavity setting.
[1]:
import numpy as np
import matplotlib.pyplot as plt
from maxwelllink.tools.harmonic_oscillator_helper import MaxwellBoltzmannInitializer, LangevinThermostat

import maxwelllink as mxl
from maxwelllink.units import unit

# define parameters
rng = np.random.default_rng(seed=114514)
random_seed = rng.integers(1919810)
n_grid = 144
n_mode_x = 144

omega_perp_cm = 2320.0
delta_omega_x_cm = 12.5
sho_frequency_cm = omega_perp_cm

coupling_strength = 2.5e-5
mu0 = 0.02
dt_fs = 0.5

# construct 144 molecules and a Fabry-Perot cavity
molecules = []
for _ in range(n_grid):
    molecules.append(
        mxl.Molecule(
            driver="sho",
            driver_kwargs={
                "omega": sho_frequency_cm*unit("cm_inv"),
                "mu0": mu0,
                "orientation": 1,
                "q_initial": 0.0,
                "p_initial": 0.0,
            },
            store_additional_data=False,
        )
    )

fbcavity = mxl.FabryPerotCavity(
        frequency_au=omega_perp_cm*unit("cm_inv"),
        coupling_strength=coupling_strength,
        coupling_axis="xy",
        n_grid_x=n_grid,
        y_grid_1d=[0.0],
        delta_omega_x_au=delta_omega_x_cm*unit("cm_inv"),
        delta_omega_y_au=0.0*unit("cm_inv"),
        n_mode_x=n_mode_x,
        n_mode_y=1,
)

sim = mxl.MultiModeSimulation(
    molecules=molecules,
    dt_au=dt_fs*unit("fs"),
    include_dse=True,
    cavity_geometry=fbcavity,
    initializer=MaxwellBoltzmannInitializer(temperature_au=300.0*unit("K"), random_seed=random_seed),
    thermostat=LangevinThermostat(temperature_au=300.0*unit("K"), dt_au=dt_fs*unit("fs"), tau_au=5000*unit("fs"), random_seed=random_seed)
)

sim.run(steps=int(20000/dt_fs),
        record_history=True,
        record_to_disk=False,
        record_every_steps=4,
        record_list=['qc'],)
[Init Molecule] Operating in non-socket mode, using driver: sho
[Init Molecule] Operating in non-socket mode, using driver: sho
[Init Molecule] Operating in non-socket mode, using driver: sho
[Init Molecule] Operating in non-socket mode, using driver: sho
[Init Molecule] Operating in non-socket mode, using driver: sho
[Init Molecule] Operating in non-socket mode, using driver: sho
[Init Molecule] Operating in non-socket mode, using driver: sho
[Init Molecule] Operating in non-socket mode, using driver: sho
[Init Molecule] Operating in non-socket mode, using driver: sho
[Init Molecule] Operating in non-socket mode, using driver: sho
[Init Molecule] Operating in non-socket mode, using driver: sho
[Init Molecule] Operating in non-socket mode, using driver: sho
[Init Molecule] Operating in non-socket mode, using driver: sho
[Init Molecule] Operating in non-socket mode, using driver: sho
[Init Molecule] Operating in non-socket mode, using driver: sho
[Init Molecule] Operating in non-socket mode, using driver: sho
[Init Molecule] Operating in non-socket mode, using driver: sho
[Init Molecule] Operating in non-socket mode, using driver: sho
[Init Molecule] Operating in non-socket mode, using driver: sho
[Init Molecule] Operating in non-socket mode, using driver: sho
[Init Molecule] Operating in non-socket mode, using driver: sho
[Init Molecule] Operating in non-socket mode, using driver: sho
[Init Molecule] Operating in non-socket mode, using driver: sho
[Init Molecule] Operating in non-socket mode, using driver: sho
[Init Molecule] Operating in non-socket mode, using driver: sho
[Init Molecule] Operating in non-socket mode, using driver: sho
[Init Molecule] Operating in non-socket mode, using driver: sho
[Init Molecule] Operating in non-socket mode, using driver: sho
[Init Molecule] Operating in non-socket mode, using driver: sho
[Init Molecule] Operating in non-socket mode, using driver: sho
[Init Molecule] Operating in non-socket mode, using driver: sho
[Init Molecule] Operating in non-socket mode, using driver: sho
[Init Molecule] Operating in non-socket mode, using driver: sho
[Init Molecule] Operating in non-socket mode, using driver: sho
[Init Molecule] Operating in non-socket mode, using driver: sho
[Init Molecule] Operating in non-socket mode, using driver: sho
[Init Molecule] Operating in non-socket mode, using driver: sho
[Init Molecule] Operating in non-socket mode, using driver: sho
[Init Molecule] Operating in non-socket mode, using driver: sho
[Init Molecule] Operating in non-socket mode, using driver: sho
[Init Molecule] Operating in non-socket mode, using driver: sho
[Init Molecule] Operating in non-socket mode, using driver: sho
[Init Molecule] Operating in non-socket mode, using driver: sho
[Init Molecule] Operating in non-socket mode, using driver: sho
[Init Molecule] Operating in non-socket mode, using driver: sho
[Init Molecule] Operating in non-socket mode, using driver: sho
[Init Molecule] Operating in non-socket mode, using driver: sho
[Init Molecule] Operating in non-socket mode, using driver: sho
[Init Molecule] Operating in non-socket mode, using driver: sho
[Init Molecule] Operating in non-socket mode, using driver: sho
[Init Molecule] Operating in non-socket mode, using driver: sho
[Init Molecule] Operating in non-socket mode, using driver: sho
[Init Molecule] Operating in non-socket mode, using driver: sho
[Init Molecule] Operating in non-socket mode, using driver: sho
[Init Molecule] Operating in non-socket mode, using driver: sho
[Init Molecule] Operating in non-socket mode, using driver: sho
[Init Molecule] Operating in non-socket mode, using driver: sho
[Init Molecule] Operating in non-socket mode, using driver: sho
[Init Molecule] Operating in non-socket mode, using driver: sho
[Init Molecule] Operating in non-socket mode, using driver: sho
[Init Molecule] Operating in non-socket mode, using driver: sho
[Init Molecule] Operating in non-socket mode, using driver: sho
[Init Molecule] Operating in non-socket mode, using driver: sho
[Init Molecule] Operating in non-socket mode, using driver: sho
[Init Molecule] Operating in non-socket mode, using driver: sho
[Init Molecule] Operating in non-socket mode, using driver: sho
[Init Molecule] Operating in non-socket mode, using driver: sho
[Init Molecule] Operating in non-socket mode, using driver: sho
[Init Molecule] Operating in non-socket mode, using driver: sho
[Init Molecule] Operating in non-socket mode, using driver: sho
[Init Molecule] Operating in non-socket mode, using driver: sho
[Init Molecule] Operating in non-socket mode, using driver: sho
[Init Molecule] Operating in non-socket mode, using driver: sho
[Init Molecule] Operating in non-socket mode, using driver: sho
[Init Molecule] Operating in non-socket mode, using driver: sho
[Init Molecule] Operating in non-socket mode, using driver: sho
[Init Molecule] Operating in non-socket mode, using driver: sho
[Init Molecule] Operating in non-socket mode, using driver: sho
[Init Molecule] Operating in non-socket mode, using driver: sho
[Init Molecule] Operating in non-socket mode, using driver: sho
[Init Molecule] Operating in non-socket mode, using driver: sho
[Init Molecule] Operating in non-socket mode, using driver: sho
[Init Molecule] Operating in non-socket mode, using driver: sho
[Init Molecule] Operating in non-socket mode, using driver: sho
[Init Molecule] Operating in non-socket mode, using driver: sho
[Init Molecule] Operating in non-socket mode, using driver: sho
[Init Molecule] Operating in non-socket mode, using driver: sho
[Init Molecule] Operating in non-socket mode, using driver: sho
[Init Molecule] Operating in non-socket mode, using driver: sho
[Init Molecule] Operating in non-socket mode, using driver: sho
[Init Molecule] Operating in non-socket mode, using driver: sho
[Init Molecule] Operating in non-socket mode, using driver: sho
[Init Molecule] Operating in non-socket mode, using driver: sho
[Init Molecule] Operating in non-socket mode, using driver: sho
[Init Molecule] Operating in non-socket mode, using driver: sho
[Init Molecule] Operating in non-socket mode, using driver: sho
[Init Molecule] Operating in non-socket mode, using driver: sho
[Init Molecule] Operating in non-socket mode, using driver: sho
[Init Molecule] Operating in non-socket mode, using driver: sho
[Init Molecule] Operating in non-socket mode, using driver: sho
[Init Molecule] Operating in non-socket mode, using driver: sho
[Init Molecule] Operating in non-socket mode, using driver: sho
[Init Molecule] Operating in non-socket mode, using driver: sho
[Init Molecule] Operating in non-socket mode, using driver: sho
[Init Molecule] Operating in non-socket mode, using driver: sho
[Init Molecule] Operating in non-socket mode, using driver: sho
[Init Molecule] Operating in non-socket mode, using driver: sho
[Init Molecule] Operating in non-socket mode, using driver: sho
[Init Molecule] Operating in non-socket mode, using driver: sho
[Init Molecule] Operating in non-socket mode, using driver: sho
[Init Molecule] Operating in non-socket mode, using driver: sho
[Init Molecule] Operating in non-socket mode, using driver: sho
[Init Molecule] Operating in non-socket mode, using driver: sho
[Init Molecule] Operating in non-socket mode, using driver: sho
[Init Molecule] Operating in non-socket mode, using driver: sho
[Init Molecule] Operating in non-socket mode, using driver: sho
[Init Molecule] Operating in non-socket mode, using driver: sho
[Init Molecule] Operating in non-socket mode, using driver: sho
[Init Molecule] Operating in non-socket mode, using driver: sho
[Init Molecule] Operating in non-socket mode, using driver: sho
[Init Molecule] Operating in non-socket mode, using driver: sho
[Init Molecule] Operating in non-socket mode, using driver: sho
[Init Molecule] Operating in non-socket mode, using driver: sho
[Init Molecule] Operating in non-socket mode, using driver: sho
[Init Molecule] Operating in non-socket mode, using driver: sho
[Init Molecule] Operating in non-socket mode, using driver: sho
[Init Molecule] Operating in non-socket mode, using driver: sho
[Init Molecule] Operating in non-socket mode, using driver: sho
[Init Molecule] Operating in non-socket mode, using driver: sho
[Init Molecule] Operating in non-socket mode, using driver: sho
[Init Molecule] Operating in non-socket mode, using driver: sho
[Init Molecule] Operating in non-socket mode, using driver: sho
[Init Molecule] Operating in non-socket mode, using driver: sho
[Init Molecule] Operating in non-socket mode, using driver: sho
[Init Molecule] Operating in non-socket mode, using driver: sho
[Init Molecule] Operating in non-socket mode, using driver: sho
[Init Molecule] Operating in non-socket mode, using driver: sho
[Init Molecule] Operating in non-socket mode, using driver: sho
[Init Molecule] Operating in non-socket mode, using driver: sho
[Init Molecule] Operating in non-socket mode, using driver: sho
[Init Molecule] Operating in non-socket mode, using driver: sho
[Init Molecule] Operating in non-socket mode, using driver: sho
[Init Molecule] Operating in non-socket mode, using driver: sho
[Init Molecule] Operating in non-socket mode, using driver: sho
[MultiModeCavity] omega_parallel in cm-1 [  12.5   25.    37.5   50.    62.5   75.    87.5  100.   112.5  125.
  137.5  150.   162.5  175.   187.5  200.   212.5  225.   237.5  250.
  262.5  275.   287.5  300.   312.5  325.   337.5  350.   362.5  375.
  387.5  400.   412.5  425.   437.5  450.   462.5  475.   487.5  500.
  512.5  525.   537.5  550.   562.5  575.   587.5  600.   612.5  625.
  637.5  650.   662.5  675.   687.5  700.   712.5  725.   737.5  750.
  762.5  775.   787.5  800.   812.5  825.   837.5  850.   862.5  875.
  887.5  900.   912.5  925.   937.5  950.   962.5  975.   987.5 1000.
 1012.5 1025.  1037.5 1050.  1062.5 1075.  1087.5 1100.  1112.5 1125.
 1137.5 1150.  1162.5 1175.  1187.5 1200.  1212.5 1225.  1237.5 1250.
 1262.5 1275.  1287.5 1300.  1312.5 1325.  1337.5 1350.  1362.5 1375.
 1387.5 1400.  1412.5 1425.  1437.5 1450.  1462.5 1475.  1487.5 1500.
 1512.5 1525.  1537.5 1550.  1562.5 1575.  1587.5 1600.  1612.5 1625.
 1637.5 1650.  1662.5 1675.  1687.5 1700.  1712.5 1725.  1737.5 1750.
 1762.5 1775.  1787.5 1800. ]
[MultiModeCavity] omega_k in cm-1 [2320.03367432 2320.13469437 2320.30305133 2320.53873055 2320.84171153
 2321.21196792 2321.64946751 2322.15417232 2322.72603852 2323.36501652
 2324.07105098 2324.84408079 2325.68403916 2326.59085359 2327.56444594
 2328.60473245 2329.71162379 2330.88502505 2332.12483585 2333.43095034
 2334.80325724 2336.2416399  2337.74597636 2339.31613939 2340.95199652
 2342.65341013 2344.4202375  2346.25233085 2348.1495374  2350.11169947
 2352.1386545  2354.23023513 2356.38626927 2358.60658017 2360.89098647
 2363.23930231 2365.65133737 2368.12689694 2370.66578201 2373.26778936
 2375.93271159 2378.66033725 2381.45045088 2384.30283311 2387.21726075
 2390.19350681 2393.23134068 2396.33052812 2399.49083141 2402.71200938
 2405.99381753 2409.33600812 2412.7383302  2416.20052976 2419.72234977
 2423.30353031 2426.94380858 2430.64291906 2434.40059358 2438.21656134
 2442.0905491  2446.02228117 2450.01147956 2454.05786403 2458.16115216
 2462.32105949 2466.53729954 2470.80958392 2475.13762244 2479.52112312
 2483.95979235 2488.45333491 2493.00145407 2497.60385169 2502.26022827
 2506.97028303 2511.73371399 2516.55021806 2521.41949108 2526.34122794
 2531.31512262 2536.34086826 2541.41815725 2546.54668129 2551.72613146
 2556.9561983  2562.23657183 2567.56694168 2572.94699712 2578.37642713
 2583.85492046 2589.38216569 2594.9578513  2600.5816657  2606.25329736
 2611.97243477 2617.73876657 2623.55198157 2629.41176882 2635.31781765
 2641.26981772 2647.2674591  2653.31043227 2659.39842822 2665.53113844
 2671.70825503 2677.92947069 2684.1944788  2690.50297342 2696.8546494
 2703.24920235 2709.68632871 2716.1657258  2722.68709183 2729.25012595
 2735.8545283  2742.5        2749.18624324 2755.91296125 2762.6798584
 2769.48664016 2776.33301317 2783.21868526 2790.14336549 2797.10676414
 2804.10859276 2811.1485642  2818.22639261 2825.34179348 2832.49448367
 2839.68418138 2846.91060625 2854.17347931 2861.47252302 2868.8074613
 2876.17801953 2883.58392456 2891.02490477 2898.50069001 2906.01101168
 2913.5556027  2921.13419753 2928.74653222 2936.39234436]
[MultiModeCavity] Applying Absorbing Boundary Condition: False, cutoff: [0.0, 0.0]
[LangevinThermostat] NVT thermostat enabled with T = 300.0 K = 0.0009500434689 a.u., Langevin tau = 5000.0 fs = 206706.866675 a.u.
[Maxwell-Boltzmann Initializer] Initializing positions with Maxwell-Boltzmann distribution at temperature 0.0009500434689 au.
[Maxwell-Boltzmann Initializer] Initializing momenta with Maxwell-Boltzmann distribution at temperature 0.0009500434689 au.
[MultiModeCavity] Recording history: True, to disk: False, record_every_steps: 4, record_max_steps: 10000
[MultiModeCavity] Recording fields : none
[MultiModeCavity] Recording address: N/A, filename: N/A
[MultiModeCavity] Temporary folder : N/A
[MultiModeCavity] Completed 1000/40000 [2.5%] steps, time/step: 5.55e-04 seconds, remaining time: 21.66 seconds.
[MultiModeCavity] Completed 2000/40000 [5.0%] steps, time/step: 5.59e-04 seconds, remaining time: 21.16 seconds.
[MultiModeCavity] Completed 3000/40000 [7.5%] steps, time/step: 5.57e-04 seconds, remaining time: 20.60 seconds.
[MultiModeCavity] Completed 4000/40000 [10.0%] steps, time/step: 5.60e-04 seconds, remaining time: 20.08 seconds.
[MultiModeCavity] Completed 5000/40000 [12.5%] steps, time/step: 5.54e-04 seconds, remaining time: 19.49 seconds.
[MultiModeCavity] Completed 6000/40000 [15.0%] steps, time/step: 5.53e-04 seconds, remaining time: 18.91 seconds.
[MultiModeCavity] Completed 7000/40000 [17.5%] steps, time/step: 5.55e-04 seconds, remaining time: 18.35 seconds.
[MultiModeCavity] Completed 8000/40000 [20.0%] steps, time/step: 5.59e-04 seconds, remaining time: 17.81 seconds.
[MultiModeCavity] Completed 9000/40000 [22.5%] steps, time/step: 5.57e-04 seconds, remaining time: 17.25 seconds.
[MultiModeCavity] Completed 10000/40000 [25.0%] steps, time/step: 5.58e-04 seconds, remaining time: 16.70 seconds.
[MultiModeCavity] Completed 11000/40000 [27.5%] steps, time/step: 5.53e-04 seconds, remaining time: 16.14 seconds.
[MultiModeCavity] Completed 12000/40000 [30.0%] steps, time/step: 5.52e-04 seconds, remaining time: 15.57 seconds.
[MultiModeCavity] Completed 13000/40000 [32.5%] steps, time/step: 5.52e-04 seconds, remaining time: 15.01 seconds.
[MultiModeCavity] Completed 14000/40000 [35.0%] steps, time/step: 5.53e-04 seconds, remaining time: 14.45 seconds.
[MultiModeCavity] Completed 15000/40000 [37.5%] steps, time/step: 5.53e-04 seconds, remaining time: 13.88 seconds.
[MultiModeCavity] Completed 16000/40000 [40.0%] steps, time/step: 5.52e-04 seconds, remaining time: 13.32 seconds.
[MultiModeCavity] Completed 17000/40000 [42.5%] steps, time/step: 5.51e-04 seconds, remaining time: 12.76 seconds.
[MultiModeCavity] Completed 18000/40000 [45.0%] steps, time/step: 5.52e-04 seconds, remaining time: 12.21 seconds.
[MultiModeCavity] Completed 19000/40000 [47.5%] steps, time/step: 5.53e-04 seconds, remaining time: 11.65 seconds.
[MultiModeCavity] Completed 20000/40000 [50.0%] steps, time/step: 5.54e-04 seconds, remaining time: 11.09 seconds.
[MultiModeCavity] Completed 21000/40000 [52.5%] steps, time/step: 5.51e-04 seconds, remaining time: 10.54 seconds.
[MultiModeCavity] Completed 22000/40000 [55.0%] steps, time/step: 5.54e-04 seconds, remaining time: 9.98 seconds.
[MultiModeCavity] Completed 23000/40000 [57.5%] steps, time/step: 5.53e-04 seconds, remaining time: 9.43 seconds.
[MultiModeCavity] Completed 24000/40000 [60.0%] steps, time/step: 5.52e-04 seconds, remaining time: 8.87 seconds.
[MultiModeCavity] Completed 25000/40000 [62.5%] steps, time/step: 5.52e-04 seconds, remaining time: 8.31 seconds.
[MultiModeCavity] Completed 26000/40000 [65.0%] steps, time/step: 5.53e-04 seconds, remaining time: 7.76 seconds.
[MultiModeCavity] Completed 27000/40000 [67.5%] steps, time/step: 5.51e-04 seconds, remaining time: 7.20 seconds.
[MultiModeCavity] Completed 28000/40000 [70.0%] steps, time/step: 5.62e-04 seconds, remaining time: 6.65 seconds.
[MultiModeCavity] Completed 29000/40000 [72.5%] steps, time/step: 5.62e-04 seconds, remaining time: 6.10 seconds.
[MultiModeCavity] Completed 30000/40000 [75.0%] steps, time/step: 5.57e-04 seconds, remaining time: 5.55 seconds.
[MultiModeCavity] Completed 31000/40000 [77.5%] steps, time/step: 5.55e-04 seconds, remaining time: 4.99 seconds.
[MultiModeCavity] Completed 32000/40000 [80.0%] steps, time/step: 5.62e-04 seconds, remaining time: 4.44 seconds.
[MultiModeCavity] Completed 33000/40000 [82.5%] steps, time/step: 5.65e-04 seconds, remaining time: 3.89 seconds.
[MultiModeCavity] Completed 34000/40000 [85.0%] steps, time/step: 5.57e-04 seconds, remaining time: 3.33 seconds.
[MultiModeCavity] Completed 35000/40000 [87.5%] steps, time/step: 5.56e-04 seconds, remaining time: 2.78 seconds.
[MultiModeCavity] Completed 36000/40000 [90.0%] steps, time/step: 5.54e-04 seconds, remaining time: 2.22 seconds.
[MultiModeCavity] Completed 37000/40000 [92.5%] steps, time/step: 5.54e-04 seconds, remaining time: 1.67 seconds.
[MultiModeCavity] Completed 38000/40000 [95.0%] steps, time/step: 5.54e-04 seconds, remaining time: 1.11 seconds.
[MultiModeCavity] Completed 39000/40000 [97.5%] steps, time/step: 5.55e-04 seconds, remaining time: 0.56 seconds.
[MultiModeCavity] Completed 40000/40000 [100.0%] steps, time/step: 5.55e-04 seconds, remaining time: 0.00 seconds.
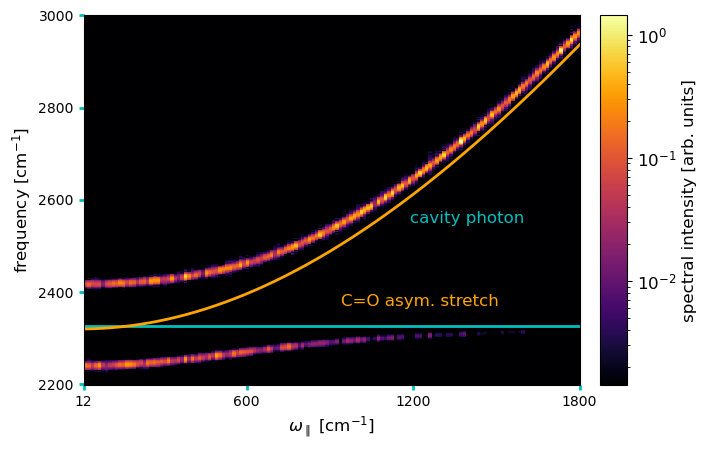
2. Linear polariton dispersion spectrum
Plot linear dispersion spectrum for photon coordinates along polarization direction y.
[2]:
from maxwelllink.tools import ir_spectrum
from matplotlib.colors import LogNorm
from matplotlib import cm

fig, ax = plt.subplots()
sp_full = np.zeros((5000,144))
qc_history = np.array(sim.qc_history)[:, :, 1]
for i in range(144):
    x, sp_full[:,i] = ir_spectrum(qc_history[:,i], 2)
dx = x[2] - x[1]
nstart, nmid, nend = int(2200 / dx), int(2350 / dx), int(3000 / dx)
x = x[nstart:nend]
sp = np.abs(sp_full[nstart:nend,:]) / 1e32
sp = sp[::-1, :]
freq_cav_inplane_min = 12.5
freq_cav_inplane_max = 12.5 * 144
extent = [freq_cav_inplane_min, freq_cav_inplane_max, x[0] , x[-1]]

vmax = np.max(np.max(sp))
vmin = vmax * 0.001
pos = ax.imshow(sp, aspect='auto', extent=extent,
        cmap=cm.inferno,
        interpolation='nearest',
        norm=LogNorm(vmin=vmin, vmax=vmax)
        )
cbar_ax = ax.inset_axes([1.04, 0.0, 0.055, 1.0])
cbar = fig.colorbar(pos, cax=cbar_ax)
cbar.ax.tick_params(labelsize=12)
cbar.set_label("spectral intensity [arb. units]", fontsize=12)

freq_cav_inplane = np.linspace(freq_cav_inplane_min, freq_cav_inplane_max, x.size)
plt.plot(freq_cav_inplane, np.ones(len(freq_cav_inplane)) * 2327, color='c', linewidth=2)
plt.plot(freq_cav_inplane, (2320.0**2 + freq_cav_inplane**2)**0.5, color='orange', linewidth=2)
ax.text(1190, 2550, "cavity photon", color='c', fontsize=12)
ax.text(940, 2370, "C=O asym. stretch", color='orange', fontsize=12)
ax.tick_params(color='c', labelsize='medium', width=2)

ax.set_xticks([12.5,600,1200,1800])
ax.set_yticks([2200,2400,2600,2800,3000])
ax.set_xlabel(r"$\omega_{\parallel}$ [cm$^{-1}$]", fontsize=12)
ax.set_ylabel(r"frequency [cm$^{-1}$]", fontsize=12)
[2]:
Text(0, 0.5, 'frequency [cm$^{-1}$]')
3. Simulated group velocity from linear spectra
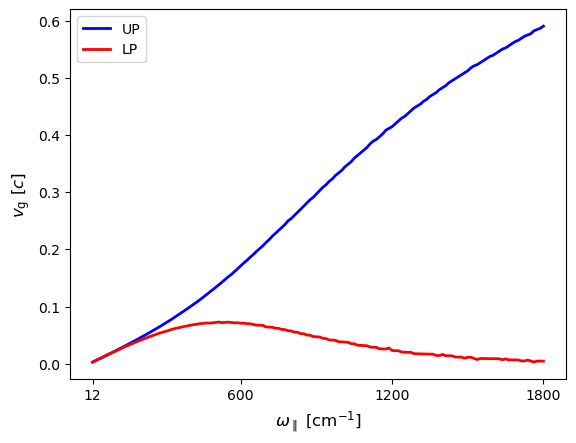
According to Jaynes–Cummings (JC) model, the polariton frequencies are:
where \(\omega_0\) and \(\Delta\) represent the molecular vibrational frequency and coupling strength in the unit of frequency, respectively. \(\omega_{k}\) denotes the cavity frequency of each cavity mode. The group velocity \(v_g^{\pm}\) (\(-\) and \(+\) denote the LP and UP, respectively) corresponding to each cavity mode becomes:
where \(c\) denotes the speed of light in the material medium. To simplify the plotting coefficient, we defined the dimensionless group velocity \(\tilde{v}_g\):
The figure below plots the analytical group velocity corresponding to the above dispersion relation.
[3]:
fig, ax = plt.subplots()
lp = np.array([x[np.argmax(sp_full[nstart:nmid, i])] for i in range(n_mode_x)])
up = np.array([x[nmid - nstart + np.argmax(sp_full[nmid:nend, i])] for i in range(n_mode_x)])

omega_0 = 2320
lp, up = lp.reshape(-1), up.reshape(-1)
wp = np.linspace(12.5, 12.5*144, 144)
wk = (omega_0**2 + wp**2)**0.5
vg_up = (0.5 + (wk - omega_0) / (4 * up - 2 * wk - 2 * omega_0)) * (wp / wk)
vg_lp = (0.5 + (wk - omega_0) / (4 * lp - 2 * wk - 2 * omega_0)) * (wp / wk)
wc_p = (up - omega_0) / (2 * up - omega_0 - wk)
plt.plot(wp, vg_up, color='b', linewidth=2, label="UP")
plt.plot(wp, vg_lp, color='r', linewidth=2, label="LP")
plt.legend()
ax.set_xticks([12.5,600,1200,1800])
ax.set_xlabel(r"$\omega_{\parallel}$ [cm$^{-1}$]", fontsize=12)
ax.set_ylabel(r"$v_{\rm g}$ $[c]$", fontsize=12)
print("group velocity of upper polariton at 450 cm^-1: ", vg_up[35])
print("group velocity of lower polariton at 450 cm^-1: ", vg_lp[35])
group velocity of upper polariton at 450 cm^-1:  0.116023088435644
group velocity of lower polariton at 450 cm^-1:  0.07039041726093086
4. 2D imaging of polariton transport
The following work uses MaxwellLink coupled to aproximately 20,000 LAMMPS MD drivers coupled to a 2D multimode cavity for simulating polariton transport dynamics on a 144*144 grid.
Xinwei Ji, Tao E. Li. Nonlinear Freezing of Vibrational Polariton Transport via Mesoscale Simulations. arXiv:2606.27463 (2026).
While this 2D simulation is too expensive to run on a local machine, below we provide a significantly simplified model for 2D polariton dynamics.
Here, 36*36 molecular grid points are placed uniformly in the 2D cavity mirror plane. Each grid point carries one SHO driver as a toy example for the molecular driver. A Gaussian pulse excites the UP frequency of a local hotspot at a particular in-plane k value, thus inducing UP transport.
[4]:
import numpy as np
import matplotlib.pyplot as plt
from maxwelllink.tools.harmonic_oscillator_helper import MaxwellBoltzmannInitializer, LangevinThermostat
from maxwelllink.tools import gaussian_pulse, k_parallel_pulse

import maxwelllink as mxl
from maxwelllink.units import unit

# define parameters
rng = np.random.default_rng(seed=114514)
random_seed = rng.integers(1919810)
n_grid_x = 36
n_grid_y = 36
n_grid = n_grid_x * n_grid_y
n_mode_x = 36
n_mode_y = 36

omega_perp_cm = 2320.0
delta_omega_x_cm = 50.0
delta_omega_y_cm = 50.0
sho_frequency_cm = omega_perp_cm

coupling_strength = 5e-5 / np.sqrt(n_grid // 36)
mu0 = 0.02
dt_fs = 0.5

molecules = []
for _ in range(n_grid):
    molecules.append(
        mxl.Molecule(
            driver="sho",
            driver_kwargs={
                "omega": sho_frequency_cm*unit("cm_inv"),
                "mu0": mu0,
                "orientation": 1,
                "q_initial": 0.0,
                "p_initial": 0.0,
            },
            store_additional_data=False,
        )
    )

fbcavity = mxl.FabryPerotCavity(
        frequency_au=omega_perp_cm*unit("cm_inv"),
        coupling_strength=coupling_strength,
        coupling_axis="xy",
        n_grid_x=n_grid_x,
        n_grid_y=n_grid_y,
        delta_omega_x_au=delta_omega_x_cm*unit("cm_inv"),
        delta_omega_y_au=delta_omega_y_cm*unit("cm_inv"),
        n_mode_x=n_mode_x,
        n_mode_y=n_mode_y,
        # apply absorbing boundary conditions to the cavity modes to avoid reflections from the boundaries
        abc_cutoff=[0.1,0.1],
        save_mode_functions=True,
)

# define the temporal profile of the pulse, which is a Gaussian envelope
pulse_envelope = gaussian_pulse(
    amplitude_au=1.0,
    t0_au=0*unit("fs"),
    sigma_au=5e2*unit("fs"),
    t_start_au=0.0*unit("fs"),
    t_end_au=1e3*unit("fs"),
)

# define the k-space profile of the pulse along the mirror plane
molecule_source = k_parallel_pulse(
    cavity=fbcavity,
    # temporal profile of the pulse
    envelope=pulse_envelope,
    # frequency of the pulse, exciting the UP
    omega_au=2438.84*unit("cm_inv"),
    # the in-plane wavevector excited by this pulse. (kx, ky) both excited
    k_parallel_au=[9*50*unit("cm_inv"),50*unit("cm_inv")],
    direction="xy",
    # spatial center of the pulse acting on the mirror plane, in units of cavity length
    center=(0.2, 0.5),
    # spatial size of the pulse hotspot, in units of cavity length
    size=(0.2, 0.2),
    # excite cavity photon degrees of freedom instead of molecules
    target="photon",
    amplitude_au=0.05,
)

sim = mxl.MultiModeSimulation(
    molecules=molecules,
    dt_au=dt_fs*unit("fs"),
    include_dse=True,
    cavity_geometry=fbcavity,
    photon_pulse_drive=molecule_source,
    photon_pulse_axis= "y",
    photon_partial_charge=0.43,
    initializer=MaxwellBoltzmannInitializer(temperature_au=300.0*unit("K"), random_seed=random_seed),
    thermostat=LangevinThermostat(temperature_au=300.0*unit("K"), dt_au=dt_fs*unit("fs"), tau_au=5000*unit("fs"), random_seed=random_seed)
)

sim.run(steps=int(1521/dt_fs),
        record_history=True,
        record_to_disk=False,
        record_every_steps=40,
        record_list=['effective_efield'],)
[Init Molecule] Operating in non-socket mode, using driver: sho
[Init Molecule] Operating in non-socket mode, using driver: sho
[Init Molecule] Operating in non-socket mode, using driver: sho
[Init Molecule] Operating in non-socket mode, using driver: sho
[Init Molecule] Operating in non-socket mode, using driver: sho
[Init Molecule] Operating in non-socket mode, using driver: sho
[Init Molecule] Operating in non-socket mode, using driver: sho
[Init Molecule] Operating in non-socket mode, using driver: sho
[Init Molecule] Operating in non-socket mode, using driver: sho
[Init Molecule] Operating in non-socket mode, using driver: sho
[Init Molecule] Operating in non-socket mode, using driver: sho
[Init Molecule] Operating in non-socket mode, using driver: sho
[Init Molecule] Operating in non-socket mode, using driver: sho
[Init Molecule] Operating in non-socket mode, using driver: sho
[Init Molecule] Operating in non-socket mode, using driver: sho
[Init Molecule] Operating in non-socket mode, using driver: sho
[Init Molecule] Operating in non-socket mode, using driver: sho
[Init Molecule] Operating in non-socket mode, using driver: sho
[Init Molecule] Operating in non-socket mode, using driver: sho
[Init Molecule] Operating in non-socket mode, using driver: sho
[Init Molecule] Operating in non-socket mode, using driver: sho
[Init Molecule] Operating in non-socket mode, using driver: sho
[Init Molecule] Operating in non-socket mode, using driver: sho
[Init Molecule] Operating in non-socket mode, using driver: sho
[Init Molecule] Operating in non-socket mode, using driver: sho
[Init Molecule] Operating in non-socket mode, using driver: sho
[Init Molecule] Operating in non-socket mode, using driver: sho
[Init Molecule] Operating in non-socket mode, using driver: sho
[Init Molecule] Operating in non-socket mode, using driver: sho
[Init Molecule] Operating in non-socket mode, using driver: sho
[Init Molecule] Operating in non-socket mode, using driver: sho
[Init Molecule] Operating in non-socket mode, using driver: sho
[Init Molecule] Operating in non-socket mode, using driver: sho
[Init Molecule] Operating in non-socket mode, using driver: sho
[Init Molecule] Operating in non-socket mode, using driver: sho
[Init Molecule] Operating in non-socket mode, using driver: sho
[Init Molecule] Operating in non-socket mode, using driver: sho
[Init Molecule] Operating in non-socket mode, using driver: sho
[Init Molecule] Operating in non-socket mode, using driver: sho
[Init Molecule] Operating in non-socket mode, using driver: sho
[Init Molecule] Operating in non-socket mode, using driver: sho
[Init Molecule] Operating in non-socket mode, using driver: sho
[Init Molecule] Operating in non-socket mode, using driver: sho
[Init Molecule] Operating in non-socket mode, using driver: sho
[Init Molecule] Operating in non-socket mode, using driver: sho
[Init Molecule] Operating in non-socket mode, using driver: sho
[Init Molecule] Operating in non-socket mode, using driver: sho
[Init Molecule] Operating in non-socket mode, using driver: sho
[Init Molecule] Operating in non-socket mode, using driver: sho
[Init Molecule] Operating in non-socket mode, using driver: sho
[Init Molecule] Operating in non-socket mode, using driver: sho
[Init Molecule] Operating in non-socket mode, using driver: sho
[Init Molecule] Operating in non-socket mode, using driver: sho
[Init Molecule] Operating in non-socket mode, using driver: sho
[Init Molecule] Operating in non-socket mode, using driver: sho
[Init Molecule] Operating in non-socket mode, using driver: sho
[Init Molecule] Operating in non-socket mode, using driver: sho
[Init Molecule] Operating in non-socket mode, using driver: sho
[Init Molecule] Operating in non-socket mode, using driver: sho
[Init Molecule] Operating in non-socket mode, using driver: sho
[Init Molecule] Operating in non-socket mode, using driver: sho
[Init Molecule] Operating in non-socket mode, using driver: sho
[Init Molecule] Operating in non-socket mode, using driver: sho
[Init Molecule] Operating in non-socket mode, using driver: sho
[Init Molecule] Operating in non-socket mode, using driver: sho
[Init Molecule] Operating in non-socket mode, using driver: sho
[Init Molecule] Operating in non-socket mode, using driver: sho
[Init Molecule] Operating in non-socket mode, using driver: sho
[Init Molecule] Operating in non-socket mode, using driver: sho
[Init Molecule] Operating in non-socket mode, using driver: sho
[Init Molecule] Operating in non-socket mode, using driver: sho
[Init Molecule] Operating in non-socket mode, using driver: sho
[Init Molecule] Operating in non-socket mode, using driver: sho
[Init Molecule] Operating in non-socket mode, using driver: sho
[Init Molecule] Operating in non-socket mode, using driver: sho
[Init Molecule] Operating in non-socket mode, using driver: sho
[Init Molecule] Operating in non-socket mode, using driver: sho
[Init Molecule] Operating in non-socket mode, using driver: sho
[Init Molecule] Operating in non-socket mode, using driver: sho
[Init Molecule] Operating in non-socket mode, using driver: sho
[Init Molecule] Operating in non-socket mode, using driver: sho
[Init Molecule] Operating in non-socket mode, using driver: sho
[Init Molecule] Operating in non-socket mode, using driver: sho
[Init Molecule] Operating in non-socket mode, using driver: sho
[Init Molecule] Operating in non-socket mode, using driver: sho
[Init Molecule] Operating in non-socket mode, using driver: sho
[Init Molecule] Operating in non-socket mode, using driver: sho
[Init Molecule] Operating in non-socket mode, using driver: sho
[Init Molecule] Operating in non-socket mode, using driver: sho
[Init Molecule] Operating in non-socket mode, using driver: sho
[Init Molecule] Operating in non-socket mode, using driver: sho
[Init Molecule] Operating in non-socket mode, using driver: sho
[Init Molecule] Operating in non-socket mode, using driver: sho
[Init Molecule] Operating in non-socket mode, using driver: sho
[Init Molecule] Operating in non-socket mode, using driver: sho
[Init Molecule] Operating in non-socket mode, using driver: sho
[Init Molecule] Operating in non-socket mode, using driver: sho
[Init Molecule] Operating in non-socket mode, using driver: sho
[Init Molecule] Operating in non-socket mode, using driver: sho
[Init Molecule] Operating in non-socket mode, using driver: sho
[Init Molecule] Operating in non-socket mode, using driver: sho
[Init Molecule] Operating in non-socket mode, using driver: sho
[Init Molecule] Operating in non-socket mode, using driver: sho
[Init Molecule] Operating in non-socket mode, using driver: sho
[Init Molecule] Operating in non-socket mode, using driver: sho
[Init Molecule] Operating in non-socket mode, using driver: sho
[Init Molecule] Operating in non-socket mode, using driver: sho
[Init Molecule] Operating in non-socket mode, using driver: sho
[Init Molecule] Operating in non-socket mode, using driver: sho
[Init Molecule] Operating in non-socket mode, using driver: sho
[Init Molecule] Operating in non-socket mode, using driver: sho
[Init Molecule] Operating in non-socket mode, using driver: sho
[Init Molecule] Operating in non-socket mode, using driver: sho
[Init Molecule] Operating in non-socket mode, using driver: sho
[Init Molecule] Operating in non-socket mode, using driver: sho
[Init Molecule] Operating in non-socket mode, using driver: sho
[Init Molecule] Operating in non-socket mode, using driver: sho
[Init Molecule] Operating in non-socket mode, using driver: sho
[Init Molecule] Operating in non-socket mode, using driver: sho
[Init Molecule] Operating in non-socket mode, using driver: sho
[Init Molecule] Operating in non-socket mode, using driver: sho
[Init Molecule] Operating in non-socket mode, using driver: sho
[Init Molecule] Operating in non-socket mode, using driver: sho
[Init Molecule] Operating in non-socket mode, using driver: sho
[Init Molecule] Operating in non-socket mode, using driver: sho
[Init Molecule] Operating in non-socket mode, using driver: sho
[Init Molecule] Operating in non-socket mode, using driver: sho
[Init Molecule] Operating in non-socket mode, using driver: sho
[Init Molecule] Operating in non-socket mode, using driver: sho
[Init Molecule] Operating in non-socket mode, using driver: sho
[Init Molecule] Operating in non-socket mode, using driver: sho
[Init Molecule] Operating in non-socket mode, using driver: sho
[Init Molecule] Operating in non-socket mode, using driver: sho
[Init Molecule] Operating in non-socket mode, using driver: sho
[Init Molecule] Operating in non-socket mode, using driver: sho
[Init Molecule] Operating in non-socket mode, using driver: sho
[Init Molecule] Operating in non-socket mode, using driver: sho
[Init Molecule] Operating in non-socket mode, using driver: sho
[Init Molecule] Operating in non-socket mode, using driver: sho
[Init Molecule] Operating in non-socket mode, using driver: sho
[Init Molecule] Operating in non-socket mode, using driver: sho
[Init Molecule] Operating in non-socket mode, using driver: sho
[Init Molecule] Operating in non-socket mode, using driver: sho
[Init Molecule] Operating in non-socket mode, using driver: sho
[Init Molecule] Operating in non-socket mode, using driver: sho
[Init Molecule] Operating in non-socket mode, using driver: sho
[Init Molecule] Operating in non-socket mode, using driver: sho
[Init Molecule] Operating in non-socket mode, using driver: sho
[Init Molecule] Operating in non-socket mode, using driver: sho
[Init Molecule] Operating in non-socket mode, using driver: sho
[Init Molecule] Operating in non-socket mode, using driver: sho
[Init Molecule] Operating in non-socket mode, using driver: sho
[Init Molecule] Operating in non-socket mode, using driver: sho
[Init Molecule] Operating in non-socket mode, using driver: sho
[Init Molecule] Operating in non-socket mode, using driver: sho
[Init Molecule] Operating in non-socket mode, using driver: sho
[Init Molecule] Operating in non-socket mode, using driver: sho
[Init Molecule] Operating in non-socket mode, using driver: sho
[Init Molecule] Operating in non-socket mode, using driver: sho
[Init Molecule] Operating in non-socket mode, using driver: sho
[Init Molecule] Operating in non-socket mode, using driver: sho
[Init Molecule] Operating in non-socket mode, using driver: sho
[Init Molecule] Operating in non-socket mode, using driver: sho
[Init Molecule] Operating in non-socket mode, using driver: sho
[Init Molecule] Operating in non-socket mode, using driver: sho
[Init Molecule] Operating in non-socket mode, using driver: sho
[Init Molecule] Operating in non-socket mode, using driver: sho
[Init Molecule] Operating in non-socket mode, using driver: sho
[Init Molecule] Operating in non-socket mode, using driver: sho
[Init Molecule] Operating in non-socket mode, using driver: sho
[Init Molecule] Operating in non-socket mode, using driver: sho
[Init Molecule] Operating in non-socket mode, using driver: sho
[Init Molecule] Operating in non-socket mode, using driver: sho
[Init Molecule] Operating in non-socket mode, using driver: sho
[Init Molecule] Operating in non-socket mode, using driver: sho
[Init Molecule] Operating in non-socket mode, using driver: sho
[Init Molecule] Operating in non-socket mode, using driver: sho
[Init Molecule] Operating in non-socket mode, using driver: sho
[Init Molecule] Operating in non-socket mode, using driver: sho
[Init Molecule] Operating in non-socket mode, using driver: sho
[Init Molecule] Operating in non-socket mode, using driver: sho
[Init Molecule] Operating in non-socket mode, using driver: sho
[Init Molecule] Operating in non-socket mode, using driver: sho
[Init Molecule] Operating in non-socket mode, using driver: sho
[Init Molecule] Operating in non-socket mode, using driver: sho
[Init Molecule] Operating in non-socket mode, using driver: sho
[Init Molecule] Operating in non-socket mode, using driver: sho
[Init Molecule] Operating in non-socket mode, using driver: sho
[Init Molecule] Operating in non-socket mode, using driver: sho
[Init Molecule] Operating in non-socket mode, using driver: sho
[Init Molecule] Operating in non-socket mode, using driver: sho
[Init Molecule] Operating in non-socket mode, using driver: sho
[Init Molecule] Operating in non-socket mode, using driver: sho
[Init Molecule] Operating in non-socket mode, using driver: sho
[Init Molecule] Operating in non-socket mode, using driver: sho
[Init Molecule] Operating in non-socket mode, using driver: sho
[Init Molecule] Operating in non-socket mode, using driver: sho
[Init Molecule] Operating in non-socket mode, using driver: sho
[Init Molecule] Operating in non-socket mode, using driver: sho
[Init Molecule] Operating in non-socket mode, using driver: sho
[Init Molecule] Operating in non-socket mode, using driver: sho
[Init Molecule] Operating in non-socket mode, using driver: sho
[Init Molecule] Operating in non-socket mode, using driver: sho
[Init Molecule] Operating in non-socket mode, using driver: sho
[Init Molecule] Operating in non-socket mode, using driver: sho
[Init Molecule] Operating in non-socket mode, using driver: sho
[Init Molecule] Operating in non-socket mode, using driver: sho
[Init Molecule] Operating in non-socket mode, using driver: sho
[Init Molecule] Operating in non-socket mode, using driver: sho
[Init Molecule] Operating in non-socket mode, using driver: sho
[Init Molecule] Operating in non-socket mode, using driver: sho
[Init Molecule] Operating in non-socket mode, using driver: sho
[Init Molecule] Operating in non-socket mode, using driver: sho
[Init Molecule] Operating in non-socket mode, using driver: sho
[Init Molecule] Operating in non-socket mode, using driver: sho
[Init Molecule] Operating in non-socket mode, using driver: sho
[Init Molecule] Operating in non-socket mode, using driver: sho
[Init Molecule] Operating in non-socket mode, using driver: sho
[Init Molecule] Operating in non-socket mode, using driver: sho
[Init Molecule] Operating in non-socket mode, using driver: sho
[Init Molecule] Operating in non-socket mode, using driver: sho
[Init Molecule] Operating in non-socket mode, using driver: sho
[Init Molecule] Operating in non-socket mode, using driver: sho
[Init Molecule] Operating in non-socket mode, using driver: sho
[Init Molecule] Operating in non-socket mode, using driver: sho
[Init Molecule] Operating in non-socket mode, using driver: sho
[Init Molecule] Operating in non-socket mode, using driver: sho
[Init Molecule] Operating in non-socket mode, using driver: sho
[Init Molecule] Operating in non-socket mode, using driver: sho
[Init Molecule] Operating in non-socket mode, using driver: sho
[Init Molecule] Operating in non-socket mode, using driver: sho
[Init Molecule] Operating in non-socket mode, using driver: sho
[Init Molecule] Operating in non-socket mode, using driver: sho
[Init Molecule] Operating in non-socket mode, using driver: sho
[Init Molecule] Operating in non-socket mode, using driver: sho
[Init Molecule] Operating in non-socket mode, using driver: sho
[Init Molecule] Operating in non-socket mode, using driver: sho
[Init Molecule] Operating in non-socket mode, using driver: sho
[Init Molecule] Operating in non-socket mode, using driver: sho
[Init Molecule] Operating in non-socket mode, using driver: sho
[Init Molecule] Operating in non-socket mode, using driver: sho
[Init Molecule] Operating in non-socket mode, using driver: sho
[Init Molecule] Operating in non-socket mode, using driver: sho
[Init Molecule] Operating in non-socket mode, using driver: sho
[Init Molecule] Operating in non-socket mode, using driver: sho
[Init Molecule] Operating in non-socket mode, using driver: sho
[Init Molecule] Operating in non-socket mode, using driver: sho
[Init Molecule] Operating in non-socket mode, using driver: sho
[Init Molecule] Operating in non-socket mode, using driver: sho
[Init Molecule] Operating in non-socket mode, using driver: sho
[Init Molecule] Operating in non-socket mode, using driver: sho
[Init Molecule] Operating in non-socket mode, using driver: sho
[Init Molecule] Operating in non-socket mode, using driver: sho
[Init Molecule] Operating in non-socket mode, using driver: sho
[Init Molecule] Operating in non-socket mode, using driver: sho
[Init Molecule] Operating in non-socket mode, using driver: sho
[Init Molecule] Operating in non-socket mode, using driver: sho
[Init Molecule] Operating in non-socket mode, using driver: sho
[Init Molecule] Operating in non-socket mode, using driver: sho
[Init Molecule] Operating in non-socket mode, using driver: sho
[Init Molecule] Operating in non-socket mode, using driver: sho
[Init Molecule] Operating in non-socket mode, using driver: sho
[Init Molecule] Operating in non-socket mode, using driver: sho
[Init Molecule] Operating in non-socket mode, using driver: sho
[Init Molecule] Operating in non-socket mode, using driver: sho
[Init Molecule] Operating in non-socket mode, using driver: sho
[Init Molecule] Operating in non-socket mode, using driver: sho
[Init Molecule] Operating in non-socket mode, using driver: sho
[Init Molecule] Operating in non-socket mode, using driver: sho
[Init Molecule] Operating in non-socket mode, using driver: sho
[Init Molecule] Operating in non-socket mode, using driver: sho
[Init Molecule] Operating in non-socket mode, using driver: sho
[Init Molecule] Operating in non-socket mode, using driver: sho
[Init Molecule] Operating in non-socket mode, using driver: sho
[Init Molecule] Operating in non-socket mode, using driver: sho
[Init Molecule] Operating in non-socket mode, using driver: sho
[Init Molecule] Operating in non-socket mode, using driver: sho
[Init Molecule] Operating in non-socket mode, using driver: sho
[Init Molecule] Operating in non-socket mode, using driver: sho
[Init Molecule] Operating in non-socket mode, using driver: sho
[Init Molecule] Operating in non-socket mode, using driver: sho
[Init Molecule] Operating in non-socket mode, using driver: sho
[Init Molecule] Operating in non-socket mode, using driver: sho
[Init Molecule] Operating in non-socket mode, using driver: sho
[Init Molecule] Operating in non-socket mode, using driver: sho
[Init Molecule] Operating in non-socket mode, using driver: sho
[Init Molecule] Operating in non-socket mode, using driver: sho
[Init Molecule] Operating in non-socket mode, using driver: sho
[Init Molecule] Operating in non-socket mode, using driver: sho
[Init Molecule] Operating in non-socket mode, using driver: sho
[Init Molecule] Operating in non-socket mode, using driver: sho
[Init Molecule] Operating in non-socket mode, using driver: sho
[Init Molecule] Operating in non-socket mode, using driver: sho
[Init Molecule] Operating in non-socket mode, using driver: sho
[Init Molecule] Operating in non-socket mode, using driver: sho
[Init Molecule] Operating in non-socket mode, using driver: sho
[Init Molecule] Operating in non-socket mode, using driver: sho
[Init Molecule] Operating in non-socket mode, using driver: sho
[Init Molecule] Operating in non-socket mode, using driver: sho
[Init Molecule] Operating in non-socket mode, using driver: sho
[Init Molecule] Operating in non-socket mode, using driver: sho
[Init Molecule] Operating in non-socket mode, using driver: sho
[Init Molecule] Operating in non-socket mode, using driver: sho
[Init Molecule] Operating in non-socket mode, using driver: sho
[Init Molecule] Operating in non-socket mode, using driver: sho
[Init Molecule] Operating in non-socket mode, using driver: sho
[Init Molecule] Operating in non-socket mode, using driver: sho
[Init Molecule] Operating in non-socket mode, using driver: sho
[Init Molecule] Operating in non-socket mode, using driver: sho
[Init Molecule] Operating in non-socket mode, using driver: sho
[Init Molecule] Operating in non-socket mode, using driver: sho
[Init Molecule] Operating in non-socket mode, using driver: sho
[Init Molecule] Operating in non-socket mode, using driver: sho
[Init Molecule] Operating in non-socket mode, using driver: sho
[Init Molecule] Operating in non-socket mode, using driver: sho
[Init Molecule] Operating in non-socket mode, using driver: sho
[Init Molecule] Operating in non-socket mode, using driver: sho
[Init Molecule] Operating in non-socket mode, using driver: sho
[Init Molecule] Operating in non-socket mode, using driver: sho
[Init Molecule] Operating in non-socket mode, using driver: sho
[Init Molecule] Operating in non-socket mode, using driver: sho
[Init Molecule] Operating in non-socket mode, using driver: sho
[Init Molecule] Operating in non-socket mode, using driver: sho
[Init Molecule] Operating in non-socket mode, using driver: sho
[Init Molecule] Operating in non-socket mode, using driver: sho
[Init Molecule] Operating in non-socket mode, using driver: sho
[Init Molecule] Operating in non-socket mode, using driver: sho
[Init Molecule] Operating in non-socket mode, using driver: sho
[Init Molecule] Operating in non-socket mode, using driver: sho
[Init Molecule] Operating in non-socket mode, using driver: sho
[Init Molecule] Operating in non-socket mode, using driver: sho
[Init Molecule] Operating in non-socket mode, using driver: sho
[Init Molecule] Operating in non-socket mode, using driver: sho
[Init Molecule] Operating in non-socket mode, using driver: sho
[Init Molecule] Operating in non-socket mode, using driver: sho
[Init Molecule] Operating in non-socket mode, using driver: sho
[Init Molecule] Operating in non-socket mode, using driver: sho
[Init Molecule] Operating in non-socket mode, using driver: sho
[Init Molecule] Operating in non-socket mode, using driver: sho
[Init Molecule] Operating in non-socket mode, using driver: sho
[Init Molecule] Operating in non-socket mode, using driver: sho
[Init Molecule] Operating in non-socket mode, using driver: sho
[Init Molecule] Operating in non-socket mode, using driver: sho
[Init Molecule] Operating in non-socket mode, using driver: sho
[Init Molecule] Operating in non-socket mode, using driver: sho
[Init Molecule] Operating in non-socket mode, using driver: sho
[Init Molecule] Operating in non-socket mode, using driver: sho
[Init Molecule] Operating in non-socket mode, using driver: sho
[Init Molecule] Operating in non-socket mode, using driver: sho
[Init Molecule] Operating in non-socket mode, using driver: sho
[Init Molecule] Operating in non-socket mode, using driver: sho
[Init Molecule] Operating in non-socket mode, using driver: sho
[Init Molecule] Operating in non-socket mode, using driver: sho
[Init Molecule] Operating in non-socket mode, using driver: sho
[Init Molecule] Operating in non-socket mode, using driver: sho
[Init Molecule] Operating in non-socket mode, using driver: sho
[Init Molecule] Operating in non-socket mode, using driver: sho
[Init Molecule] Operating in non-socket mode, using driver: sho
[Init Molecule] Operating in non-socket mode, using driver: sho
[Init Molecule] Operating in non-socket mode, using driver: sho
[Init Molecule] Operating in non-socket mode, using driver: sho
[Init Molecule] Operating in non-socket mode, using driver: sho
[Init Molecule] Operating in non-socket mode, using driver: sho
[Init Molecule] Operating in non-socket mode, using driver: sho
[Init Molecule] Operating in non-socket mode, using driver: sho
[Init Molecule] Operating in non-socket mode, using driver: sho
[Init Molecule] Operating in non-socket mode, using driver: sho
[Init Molecule] Operating in non-socket mode, using driver: sho
[Init Molecule] Operating in non-socket mode, using driver: sho
[Init Molecule] Operating in non-socket mode, using driver: sho
[Init Molecule] Operating in non-socket mode, using driver: sho
[Init Molecule] Operating in non-socket mode, using driver: sho
[Init Molecule] Operating in non-socket mode, using driver: sho
[Init Molecule] Operating in non-socket mode, using driver: sho
[Init Molecule] Operating in non-socket mode, using driver: sho
[Init Molecule] Operating in non-socket mode, using driver: sho
[Init Molecule] Operating in non-socket mode, using driver: sho
[Init Molecule] Operating in non-socket mode, using driver: sho
[Init Molecule] Operating in non-socket mode, using driver: sho
[Init Molecule] Operating in non-socket mode, using driver: sho
[Init Molecule] Operating in non-socket mode, using driver: sho
[Init Molecule] Operating in non-socket mode, using driver: sho
[Init Molecule] Operating in non-socket mode, using driver: sho
[Init Molecule] Operating in non-socket mode, using driver: sho
[Init Molecule] Operating in non-socket mode, using driver: sho
[Init Molecule] Operating in non-socket mode, using driver: sho
[Init Molecule] Operating in non-socket mode, using driver: sho
[Init Molecule] Operating in non-socket mode, using driver: sho
[Init Molecule] Operating in non-socket mode, using driver: sho
[Init Molecule] Operating in non-socket mode, using driver: sho
[Init Molecule] Operating in non-socket mode, using driver: sho
[Init Molecule] Operating in non-socket mode, using driver: sho
[Init Molecule] Operating in non-socket mode, using driver: sho
[Init Molecule] Operating in non-socket mode, using driver: sho
[Init Molecule] Operating in non-socket mode, using driver: sho
[Init Molecule] Operating in non-socket mode, using driver: sho
[Init Molecule] Operating in non-socket mode, using driver: sho
[Init Molecule] Operating in non-socket mode, using driver: sho
[Init Molecule] Operating in non-socket mode, using driver: sho
[Init Molecule] Operating in non-socket mode, using driver: sho
[Init Molecule] Operating in non-socket mode, using driver: sho
[Init Molecule] Operating in non-socket mode, using driver: sho
[Init Molecule] Operating in non-socket mode, using driver: sho
[Init Molecule] Operating in non-socket mode, using driver: sho
[Init Molecule] Operating in non-socket mode, using driver: sho
[Init Molecule] Operating in non-socket mode, using driver: sho
[Init Molecule] Operating in non-socket mode, using driver: sho
[Init Molecule] Operating in non-socket mode, using driver: sho
[Init Molecule] Operating in non-socket mode, using driver: sho
[Init Molecule] Operating in non-socket mode, using driver: sho
[Init Molecule] Operating in non-socket mode, using driver: sho
[Init Molecule] Operating in non-socket mode, using driver: sho
[Init Molecule] Operating in non-socket mode, using driver: sho
[Init Molecule] Operating in non-socket mode, using driver: sho
[Init Molecule] Operating in non-socket mode, using driver: sho
[Init Molecule] Operating in non-socket mode, using driver: sho
[Init Molecule] Operating in non-socket mode, using driver: sho
[Init Molecule] Operating in non-socket mode, using driver: sho
[Init Molecule] Operating in non-socket mode, using driver: sho
[Init Molecule] Operating in non-socket mode, using driver: sho
[Init Molecule] Operating in non-socket mode, using driver: sho
[Init Molecule] Operating in non-socket mode, using driver: sho
[Init Molecule] Operating in non-socket mode, using driver: sho
[Init Molecule] Operating in non-socket mode, using driver: sho
[Init Molecule] Operating in non-socket mode, using driver: sho
[Init Molecule] Operating in non-socket mode, using driver: sho
[Init Molecule] Operating in non-socket mode, using driver: sho
[Init Molecule] Operating in non-socket mode, using driver: sho
[Init Molecule] Operating in non-socket mode, using driver: sho
[Init Molecule] Operating in non-socket mode, using driver: sho
[Init Molecule] Operating in non-socket mode, using driver: sho
[Init Molecule] Operating in non-socket mode, using driver: sho
[Init Molecule] Operating in non-socket mode, using driver: sho
[Init Molecule] Operating in non-socket mode, using driver: sho
[Init Molecule] Operating in non-socket mode, using driver: sho
[Init Molecule] Operating in non-socket mode, using driver: sho
[Init Molecule] Operating in non-socket mode, using driver: sho
[Init Molecule] Operating in non-socket mode, using driver: sho
[Init Molecule] Operating in non-socket mode, using driver: sho
[Init Molecule] Operating in non-socket mode, using driver: sho
[Init Molecule] Operating in non-socket mode, using driver: sho
[Init Molecule] Operating in non-socket mode, using driver: sho
[Init Molecule] Operating in non-socket mode, using driver: sho
[Init Molecule] Operating in non-socket mode, using driver: sho
[Init Molecule] Operating in non-socket mode, using driver: sho
[Init Molecule] Operating in non-socket mode, using driver: sho
[Init Molecule] Operating in non-socket mode, using driver: sho
[Init Molecule] Operating in non-socket mode, using driver: sho
[Init Molecule] Operating in non-socket mode, using driver: sho
[Init Molecule] Operating in non-socket mode, using driver: sho
[Init Molecule] Operating in non-socket mode, using driver: sho
[Init Molecule] Operating in non-socket mode, using driver: sho
[Init Molecule] Operating in non-socket mode, using driver: sho
[Init Molecule] Operating in non-socket mode, using driver: sho
[Init Molecule] Operating in non-socket mode, using driver: sho
[Init Molecule] Operating in non-socket mode, using driver: sho
[Init Molecule] Operating in non-socket mode, using driver: sho
[Init Molecule] Operating in non-socket mode, using driver: sho
[Init Molecule] Operating in non-socket mode, using driver: sho
[Init Molecule] Operating in non-socket mode, using driver: sho
[Init Molecule] Operating in non-socket mode, using driver: sho
[Init Molecule] Operating in non-socket mode, using driver: sho
[Init Molecule] Operating in non-socket mode, using driver: sho
[Init Molecule] Operating in non-socket mode, using driver: sho
[Init Molecule] Operating in non-socket mode, using driver: sho
[Init Molecule] Operating in non-socket mode, using driver: sho
[Init Molecule] Operating in non-socket mode, using driver: sho
[Init Molecule] Operating in non-socket mode, using driver: sho
[Init Molecule] Operating in non-socket mode, using driver: sho
[Init Molecule] Operating in non-socket mode, using driver: sho
[Init Molecule] Operating in non-socket mode, using driver: sho
[Init Molecule] Operating in non-socket mode, using driver: sho
[Init Molecule] Operating in non-socket mode, using driver: sho
[Init Molecule] Operating in non-socket mode, using driver: sho
[Init Molecule] Operating in non-socket mode, using driver: sho
[Init Molecule] Operating in non-socket mode, using driver: sho
[Init Molecule] Operating in non-socket mode, using driver: sho
[Init Molecule] Operating in non-socket mode, using driver: sho
[Init Molecule] Operating in non-socket mode, using driver: sho
[Init Molecule] Operating in non-socket mode, using driver: sho
[Init Molecule] Operating in non-socket mode, using driver: sho
[Init Molecule] Operating in non-socket mode, using driver: sho
[Init Molecule] Operating in non-socket mode, using driver: sho
[Init Molecule] Operating in non-socket mode, using driver: sho
[Init Molecule] Operating in non-socket mode, using driver: sho
[Init Molecule] Operating in non-socket mode, using driver: sho
[Init Molecule] Operating in non-socket mode, using driver: sho
[Init Molecule] Operating in non-socket mode, using driver: sho
[Init Molecule] Operating in non-socket mode, using driver: sho
[Init Molecule] Operating in non-socket mode, using driver: sho
[Init Molecule] Operating in non-socket mode, using driver: sho
[Init Molecule] Operating in non-socket mode, using driver: sho
[Init Molecule] Operating in non-socket mode, using driver: sho
[Init Molecule] Operating in non-socket mode, using driver: sho
[Init Molecule] Operating in non-socket mode, using driver: sho
[Init Molecule] Operating in non-socket mode, using driver: sho
[Init Molecule] Operating in non-socket mode, using driver: sho
[Init Molecule] Operating in non-socket mode, using driver: sho
[Init Molecule] Operating in non-socket mode, using driver: sho
[Init Molecule] Operating in non-socket mode, using driver: sho
[Init Molecule] Operating in non-socket mode, using driver: sho
[Init Molecule] Operating in non-socket mode, using driver: sho
[Init Molecule] Operating in non-socket mode, using driver: sho
[Init Molecule] Operating in non-socket mode, using driver: sho
[Init Molecule] Operating in non-socket mode, using driver: sho
[Init Molecule] Operating in non-socket mode, using driver: sho
[Init Molecule] Operating in non-socket mode, using driver: sho
[Init Molecule] Operating in non-socket mode, using driver: sho
[Init Molecule] Operating in non-socket mode, using driver: sho
[Init Molecule] Operating in non-socket mode, using driver: sho
[Init Molecule] Operating in non-socket mode, using driver: sho
[Init Molecule] Operating in non-socket mode, using driver: sho
[Init Molecule] Operating in non-socket mode, using driver: sho
[Init Molecule] Operating in non-socket mode, using driver: sho
[Init Molecule] Operating in non-socket mode, using driver: sho
[Init Molecule] Operating in non-socket mode, using driver: sho
[Init Molecule] Operating in non-socket mode, using driver: sho
[Init Molecule] Operating in non-socket mode, using driver: sho
[Init Molecule] Operating in non-socket mode, using driver: sho
[Init Molecule] Operating in non-socket mode, using driver: sho
[Init Molecule] Operating in non-socket mode, using driver: sho
[Init Molecule] Operating in non-socket mode, using driver: sho
[Init Molecule] Operating in non-socket mode, using driver: sho
[Init Molecule] Operating in non-socket mode, using driver: sho
[Init Molecule] Operating in non-socket mode, using driver: sho
[Init Molecule] Operating in non-socket mode, using driver: sho
[Init Molecule] Operating in non-socket mode, using driver: sho
[Init Molecule] Operating in non-socket mode, using driver: sho
[Init Molecule] Operating in non-socket mode, using driver: sho
[Init Molecule] Operating in non-socket mode, using driver: sho
[Init Molecule] Operating in non-socket mode, using driver: sho
[Init Molecule] Operating in non-socket mode, using driver: sho
[Init Molecule] Operating in non-socket mode, using driver: sho
[Init Molecule] Operating in non-socket mode, using driver: sho
[Init Molecule] Operating in non-socket mode, using driver: sho
[Init Molecule] Operating in non-socket mode, using driver: sho
[Init Molecule] Operating in non-socket mode, using driver: sho
[Init Molecule] Operating in non-socket mode, using driver: sho
[Init Molecule] Operating in non-socket mode, using driver: sho
[Init Molecule] Operating in non-socket mode, using driver: sho
[Init Molecule] Operating in non-socket mode, using driver: sho
[Init Molecule] Operating in non-socket mode, using driver: sho
[Init Molecule] Operating in non-socket mode, using driver: sho
[Init Molecule] Operating in non-socket mode, using driver: sho
[Init Molecule] Operating in non-socket mode, using driver: sho
[Init Molecule] Operating in non-socket mode, using driver: sho
[Init Molecule] Operating in non-socket mode, using driver: sho
[Init Molecule] Operating in non-socket mode, using driver: sho
[Init Molecule] Operating in non-socket mode, using driver: sho
[Init Molecule] Operating in non-socket mode, using driver: sho
[Init Molecule] Operating in non-socket mode, using driver: sho
[Init Molecule] Operating in non-socket mode, using driver: sho
[Init Molecule] Operating in non-socket mode, using driver: sho
[Init Molecule] Operating in non-socket mode, using driver: sho
[Init Molecule] Operating in non-socket mode, using driver: sho
[Init Molecule] Operating in non-socket mode, using driver: sho
[Init Molecule] Operating in non-socket mode, using driver: sho
[Init Molecule] Operating in non-socket mode, using driver: sho
[Init Molecule] Operating in non-socket mode, using driver: sho
[Init Molecule] Operating in non-socket mode, using driver: sho
[Init Molecule] Operating in non-socket mode, using driver: sho
[Init Molecule] Operating in non-socket mode, using driver: sho
[Init Molecule] Operating in non-socket mode, using driver: sho
[Init Molecule] Operating in non-socket mode, using driver: sho
[Init Molecule] Operating in non-socket mode, using driver: sho
[Init Molecule] Operating in non-socket mode, using driver: sho
[Init Molecule] Operating in non-socket mode, using driver: sho
[Init Molecule] Operating in non-socket mode, using driver: sho
[Init Molecule] Operating in non-socket mode, using driver: sho
[Init Molecule] Operating in non-socket mode, using driver: sho
[Init Molecule] Operating in non-socket mode, using driver: sho
[Init Molecule] Operating in non-socket mode, using driver: sho
[Init Molecule] Operating in non-socket mode, using driver: sho
[Init Molecule] Operating in non-socket mode, using driver: sho
[Init Molecule] Operating in non-socket mode, using driver: sho
[Init Molecule] Operating in non-socket mode, using driver: sho
[Init Molecule] Operating in non-socket mode, using driver: sho
[Init Molecule] Operating in non-socket mode, using driver: sho
[Init Molecule] Operating in non-socket mode, using driver: sho
[Init Molecule] Operating in non-socket mode, using driver: sho
[Init Molecule] Operating in non-socket mode, using driver: sho
[Init Molecule] Operating in non-socket mode, using driver: sho
[Init Molecule] Operating in non-socket mode, using driver: sho
[Init Molecule] Operating in non-socket mode, using driver: sho
[Init Molecule] Operating in non-socket mode, using driver: sho
[Init Molecule] Operating in non-socket mode, using driver: sho
[Init Molecule] Operating in non-socket mode, using driver: sho
[Init Molecule] Operating in non-socket mode, using driver: sho
[Init Molecule] Operating in non-socket mode, using driver: sho
[Init Molecule] Operating in non-socket mode, using driver: sho
[Init Molecule] Operating in non-socket mode, using driver: sho
[Init Molecule] Operating in non-socket mode, using driver: sho
[Init Molecule] Operating in non-socket mode, using driver: sho
[Init Molecule] Operating in non-socket mode, using driver: sho
[Init Molecule] Operating in non-socket mode, using driver: sho
[Init Molecule] Operating in non-socket mode, using driver: sho
[Init Molecule] Operating in non-socket mode, using driver: sho
[Init Molecule] Operating in non-socket mode, using driver: sho
[Init Molecule] Operating in non-socket mode, using driver: sho
[Init Molecule] Operating in non-socket mode, using driver: sho
[Init Molecule] Operating in non-socket mode, using driver: sho
[Init Molecule] Operating in non-socket mode, using driver: sho
[Init Molecule] Operating in non-socket mode, using driver: sho
[Init Molecule] Operating in non-socket mode, using driver: sho
[Init Molecule] Operating in non-socket mode, using driver: sho
[Init Molecule] Operating in non-socket mode, using driver: sho
[Init Molecule] Operating in non-socket mode, using driver: sho
[Init Molecule] Operating in non-socket mode, using driver: sho
[Init Molecule] Operating in non-socket mode, using driver: sho
[Init Molecule] Operating in non-socket mode, using driver: sho
[Init Molecule] Operating in non-socket mode, using driver: sho
[Init Molecule] Operating in non-socket mode, using driver: sho
[Init Molecule] Operating in non-socket mode, using driver: sho
[Init Molecule] Operating in non-socket mode, using driver: sho
[Init Molecule] Operating in non-socket mode, using driver: sho
[Init Molecule] Operating in non-socket mode, using driver: sho
[Init Molecule] Operating in non-socket mode, using driver: sho
[Init Molecule] Operating in non-socket mode, using driver: sho
[Init Molecule] Operating in non-socket mode, using driver: sho
[Init Molecule] Operating in non-socket mode, using driver: sho
[Init Molecule] Operating in non-socket mode, using driver: sho
[Init Molecule] Operating in non-socket mode, using driver: sho
[Init Molecule] Operating in non-socket mode, using driver: sho
[Init Molecule] Operating in non-socket mode, using driver: sho
[Init Molecule] Operating in non-socket mode, using driver: sho
[Init Molecule] Operating in non-socket mode, using driver: sho
[Init Molecule] Operating in non-socket mode, using driver: sho
[Init Molecule] Operating in non-socket mode, using driver: sho
[Init Molecule] Operating in non-socket mode, using driver: sho
[Init Molecule] Operating in non-socket mode, using driver: sho
[Init Molecule] Operating in non-socket mode, using driver: sho
[Init Molecule] Operating in non-socket mode, using driver: sho
[Init Molecule] Operating in non-socket mode, using driver: sho
[Init Molecule] Operating in non-socket mode, using driver: sho
[Init Molecule] Operating in non-socket mode, using driver: sho
[Init Molecule] Operating in non-socket mode, using driver: sho
[Init Molecule] Operating in non-socket mode, using driver: sho
[Init Molecule] Operating in non-socket mode, using driver: sho
[Init Molecule] Operating in non-socket mode, using driver: sho
[Init Molecule] Operating in non-socket mode, using driver: sho
[Init Molecule] Operating in non-socket mode, using driver: sho
[Init Molecule] Operating in non-socket mode, using driver: sho
[Init Molecule] Operating in non-socket mode, using driver: sho
[Init Molecule] Operating in non-socket mode, using driver: sho
[Init Molecule] Operating in non-socket mode, using driver: sho
[Init Molecule] Operating in non-socket mode, using driver: sho
[Init Molecule] Operating in non-socket mode, using driver: sho
[Init Molecule] Operating in non-socket mode, using driver: sho
[Init Molecule] Operating in non-socket mode, using driver: sho
[Init Molecule] Operating in non-socket mode, using driver: sho
[Init Molecule] Operating in non-socket mode, using driver: sho
[Init Molecule] Operating in non-socket mode, using driver: sho
[Init Molecule] Operating in non-socket mode, using driver: sho
[Init Molecule] Operating in non-socket mode, using driver: sho
[Init Molecule] Operating in non-socket mode, using driver: sho
[Init Molecule] Operating in non-socket mode, using driver: sho
[Init Molecule] Operating in non-socket mode, using driver: sho
[Init Molecule] Operating in non-socket mode, using driver: sho
[Init Molecule] Operating in non-socket mode, using driver: sho
[Init Molecule] Operating in non-socket mode, using driver: sho
[Init Molecule] Operating in non-socket mode, using driver: sho
[Init Molecule] Operating in non-socket mode, using driver: sho
[Init Molecule] Operating in non-socket mode, using driver: sho
[Init Molecule] Operating in non-socket mode, using driver: sho
[Init Molecule] Operating in non-socket mode, using driver: sho
[Init Molecule] Operating in non-socket mode, using driver: sho
[Init Molecule] Operating in non-socket mode, using driver: sho
[Init Molecule] Operating in non-socket mode, using driver: sho
[Init Molecule] Operating in non-socket mode, using driver: sho
[Init Molecule] Operating in non-socket mode, using driver: sho
[Init Molecule] Operating in non-socket mode, using driver: sho
[Init Molecule] Operating in non-socket mode, using driver: sho
[Init Molecule] Operating in non-socket mode, using driver: sho
[Init Molecule] Operating in non-socket mode, using driver: sho
[Init Molecule] Operating in non-socket mode, using driver: sho
[Init Molecule] Operating in non-socket mode, using driver: sho
[Init Molecule] Operating in non-socket mode, using driver: sho
[Init Molecule] Operating in non-socket mode, using driver: sho
[Init Molecule] Operating in non-socket mode, using driver: sho
[Init Molecule] Operating in non-socket mode, using driver: sho
[Init Molecule] Operating in non-socket mode, using driver: sho
[Init Molecule] Operating in non-socket mode, using driver: sho
[Init Molecule] Operating in non-socket mode, using driver: sho
[Init Molecule] Operating in non-socket mode, using driver: sho
[Init Molecule] Operating in non-socket mode, using driver: sho
[Init Molecule] Operating in non-socket mode, using driver: sho
[Init Molecule] Operating in non-socket mode, using driver: sho
[Init Molecule] Operating in non-socket mode, using driver: sho
[Init Molecule] Operating in non-socket mode, using driver: sho
[Init Molecule] Operating in non-socket mode, using driver: sho
[Init Molecule] Operating in non-socket mode, using driver: sho
[Init Molecule] Operating in non-socket mode, using driver: sho
[Init Molecule] Operating in non-socket mode, using driver: sho
[Init Molecule] Operating in non-socket mode, using driver: sho
[Init Molecule] Operating in non-socket mode, using driver: sho
[Init Molecule] Operating in non-socket mode, using driver: sho
[Init Molecule] Operating in non-socket mode, using driver: sho
[Init Molecule] Operating in non-socket mode, using driver: sho
[Init Molecule] Operating in non-socket mode, using driver: sho
[Init Molecule] Operating in non-socket mode, using driver: sho
[Init Molecule] Operating in non-socket mode, using driver: sho
[Init Molecule] Operating in non-socket mode, using driver: sho
[Init Molecule] Operating in non-socket mode, using driver: sho
[Init Molecule] Operating in non-socket mode, using driver: sho
[Init Molecule] Operating in non-socket mode, using driver: sho
[Init Molecule] Operating in non-socket mode, using driver: sho
[Init Molecule] Operating in non-socket mode, using driver: sho
[Init Molecule] Operating in non-socket mode, using driver: sho
[Init Molecule] Operating in non-socket mode, using driver: sho
[Init Molecule] Operating in non-socket mode, using driver: sho
[Init Molecule] Operating in non-socket mode, using driver: sho
[Init Molecule] Operating in non-socket mode, using driver: sho
[Init Molecule] Operating in non-socket mode, using driver: sho
[Init Molecule] Operating in non-socket mode, using driver: sho
[Init Molecule] Operating in non-socket mode, using driver: sho
[Init Molecule] Operating in non-socket mode, using driver: sho
[Init Molecule] Operating in non-socket mode, using driver: sho
[Init Molecule] Operating in non-socket mode, using driver: sho
[Init Molecule] Operating in non-socket mode, using driver: sho
[Init Molecule] Operating in non-socket mode, using driver: sho
[Init Molecule] Operating in non-socket mode, using driver: sho
[Init Molecule] Operating in non-socket mode, using driver: sho
[Init Molecule] Operating in non-socket mode, using driver: sho
[Init Molecule] Operating in non-socket mode, using driver: sho
[Init Molecule] Operating in non-socket mode, using driver: sho
[Init Molecule] Operating in non-socket mode, using driver: sho
[Init Molecule] Operating in non-socket mode, using driver: sho
[Init Molecule] Operating in non-socket mode, using driver: sho
[Init Molecule] Operating in non-socket mode, using driver: sho
[Init Molecule] Operating in non-socket mode, using driver: sho
[Init Molecule] Operating in non-socket mode, using driver: sho
[Init Molecule] Operating in non-socket mode, using driver: sho
[Init Molecule] Operating in non-socket mode, using driver: sho
[Init Molecule] Operating in non-socket mode, using driver: sho
[Init Molecule] Operating in non-socket mode, using driver: sho
[Init Molecule] Operating in non-socket mode, using driver: sho
[Init Molecule] Operating in non-socket mode, using driver: sho
[Init Molecule] Operating in non-socket mode, using driver: sho
[Init Molecule] Operating in non-socket mode, using driver: sho
[Init Molecule] Operating in non-socket mode, using driver: sho
[Init Molecule] Operating in non-socket mode, using driver: sho
[Init Molecule] Operating in non-socket mode, using driver: sho
[Init Molecule] Operating in non-socket mode, using driver: sho
[Init Molecule] Operating in non-socket mode, using driver: sho
[Init Molecule] Operating in non-socket mode, using driver: sho
[Init Molecule] Operating in non-socket mode, using driver: sho
[Init Molecule] Operating in non-socket mode, using driver: sho
[Init Molecule] Operating in non-socket mode, using driver: sho
[Init Molecule] Operating in non-socket mode, using driver: sho
[Init Molecule] Operating in non-socket mode, using driver: sho
[Init Molecule] Operating in non-socket mode, using driver: sho
[Init Molecule] Operating in non-socket mode, using driver: sho
[Init Molecule] Operating in non-socket mode, using driver: sho
[Init Molecule] Operating in non-socket mode, using driver: sho
[Init Molecule] Operating in non-socket mode, using driver: sho
[Init Molecule] Operating in non-socket mode, using driver: sho
[Init Molecule] Operating in non-socket mode, using driver: sho
[Init Molecule] Operating in non-socket mode, using driver: sho
[Init Molecule] Operating in non-socket mode, using driver: sho
[Init Molecule] Operating in non-socket mode, using driver: sho
[Init Molecule] Operating in non-socket mode, using driver: sho
[Init Molecule] Operating in non-socket mode, using driver: sho
[Init Molecule] Operating in non-socket mode, using driver: sho
[Init Molecule] Operating in non-socket mode, using driver: sho
[Init Molecule] Operating in non-socket mode, using driver: sho
[Init Molecule] Operating in non-socket mode, using driver: sho
[Init Molecule] Operating in non-socket mode, using driver: sho
[Init Molecule] Operating in non-socket mode, using driver: sho
[Init Molecule] Operating in non-socket mode, using driver: sho
[Init Molecule] Operating in non-socket mode, using driver: sho
[Init Molecule] Operating in non-socket mode, using driver: sho
[Init Molecule] Operating in non-socket mode, using driver: sho
[Init Molecule] Operating in non-socket mode, using driver: sho
[Init Molecule] Operating in non-socket mode, using driver: sho
[Init Molecule] Operating in non-socket mode, using driver: sho
[Init Molecule] Operating in non-socket mode, using driver: sho
[Init Molecule] Operating in non-socket mode, using driver: sho
[Init Molecule] Operating in non-socket mode, using driver: sho
[Init Molecule] Operating in non-socket mode, using driver: sho
[Init Molecule] Operating in non-socket mode, using driver: sho
[Init Molecule] Operating in non-socket mode, using driver: sho
[Init Molecule] Operating in non-socket mode, using driver: sho
[Init Molecule] Operating in non-socket mode, using driver: sho
[Init Molecule] Operating in non-socket mode, using driver: sho
[Init Molecule] Operating in non-socket mode, using driver: sho
[Init Molecule] Operating in non-socket mode, using driver: sho
[Init Molecule] Operating in non-socket mode, using driver: sho
[Init Molecule] Operating in non-socket mode, using driver: sho
[Init Molecule] Operating in non-socket mode, using driver: sho
[Init Molecule] Operating in non-socket mode, using driver: sho
[Init Molecule] Operating in non-socket mode, using driver: sho
[Init Molecule] Operating in non-socket mode, using driver: sho
[Init Molecule] Operating in non-socket mode, using driver: sho
[Init Molecule] Operating in non-socket mode, using driver: sho
[Init Molecule] Operating in non-socket mode, using driver: sho
[Init Molecule] Operating in non-socket mode, using driver: sho
[Init Molecule] Operating in non-socket mode, using driver: sho
[Init Molecule] Operating in non-socket mode, using driver: sho
[Init Molecule] Operating in non-socket mode, using driver: sho
[Init Molecule] Operating in non-socket mode, using driver: sho
[Init Molecule] Operating in non-socket mode, using driver: sho
[Init Molecule] Operating in non-socket mode, using driver: sho
[Init Molecule] Operating in non-socket mode, using driver: sho
[Init Molecule] Operating in non-socket mode, using driver: sho
[Init Molecule] Operating in non-socket mode, using driver: sho
[Init Molecule] Operating in non-socket mode, using driver: sho
[Init Molecule] Operating in non-socket mode, using driver: sho
[Init Molecule] Operating in non-socket mode, using driver: sho
[Init Molecule] Operating in non-socket mode, using driver: sho
[Init Molecule] Operating in non-socket mode, using driver: sho
[Init Molecule] Operating in non-socket mode, using driver: sho
[Init Molecule] Operating in non-socket mode, using driver: sho
[Init Molecule] Operating in non-socket mode, using driver: sho
[Init Molecule] Operating in non-socket mode, using driver: sho
[Init Molecule] Operating in non-socket mode, using driver: sho
[Init Molecule] Operating in non-socket mode, using driver: sho
[Init Molecule] Operating in non-socket mode, using driver: sho
[Init Molecule] Operating in non-socket mode, using driver: sho
[Init Molecule] Operating in non-socket mode, using driver: sho
[Init Molecule] Operating in non-socket mode, using driver: sho
[Init Molecule] Operating in non-socket mode, using driver: sho
[Init Molecule] Operating in non-socket mode, using driver: sho
[Init Molecule] Operating in non-socket mode, using driver: sho
[Init Molecule] Operating in non-socket mode, using driver: sho
[Init Molecule] Operating in non-socket mode, using driver: sho
[Init Molecule] Operating in non-socket mode, using driver: sho
[Init Molecule] Operating in non-socket mode, using driver: sho
[Init Molecule] Operating in non-socket mode, using driver: sho
[Init Molecule] Operating in non-socket mode, using driver: sho
[Init Molecule] Operating in non-socket mode, using driver: sho
[Init Molecule] Operating in non-socket mode, using driver: sho
[Init Molecule] Operating in non-socket mode, using driver: sho
[Init Molecule] Operating in non-socket mode, using driver: sho
[Init Molecule] Operating in non-socket mode, using driver: sho
[Init Molecule] Operating in non-socket mode, using driver: sho
[Init Molecule] Operating in non-socket mode, using driver: sho
[Init Molecule] Operating in non-socket mode, using driver: sho
[Init Molecule] Operating in non-socket mode, using driver: sho
[Init Molecule] Operating in non-socket mode, using driver: sho
[Init Molecule] Operating in non-socket mode, using driver: sho
[Init Molecule] Operating in non-socket mode, using driver: sho
[Init Molecule] Operating in non-socket mode, using driver: sho
[Init Molecule] Operating in non-socket mode, using driver: sho
[Init Molecule] Operating in non-socket mode, using driver: sho
[Init Molecule] Operating in non-socket mode, using driver: sho
[Init Molecule] Operating in non-socket mode, using driver: sho
[Init Molecule] Operating in non-socket mode, using driver: sho
[Init Molecule] Operating in non-socket mode, using driver: sho
[Init Molecule] Operating in non-socket mode, using driver: sho
[Init Molecule] Operating in non-socket mode, using driver: sho
[Init Molecule] Operating in non-socket mode, using driver: sho
[Init Molecule] Operating in non-socket mode, using driver: sho
[Init Molecule] Operating in non-socket mode, using driver: sho
[Init Molecule] Operating in non-socket mode, using driver: sho
[Init Molecule] Operating in non-socket mode, using driver: sho
[Init Molecule] Operating in non-socket mode, using driver: sho
[Init Molecule] Operating in non-socket mode, using driver: sho
[Init Molecule] Operating in non-socket mode, using driver: sho
[Init Molecule] Operating in non-socket mode, using driver: sho
[Init Molecule] Operating in non-socket mode, using driver: sho
[Init Molecule] Operating in non-socket mode, using driver: sho
[Init Molecule] Operating in non-socket mode, using driver: sho
[Init Molecule] Operating in non-socket mode, using driver: sho
[Init Molecule] Operating in non-socket mode, using driver: sho
[Init Molecule] Operating in non-socket mode, using driver: sho
[Init Molecule] Operating in non-socket mode, using driver: sho
[Init Molecule] Operating in non-socket mode, using driver: sho
[Init Molecule] Operating in non-socket mode, using driver: sho
[Init Molecule] Operating in non-socket mode, using driver: sho
[Init Molecule] Operating in non-socket mode, using driver: sho
[Init Molecule] Operating in non-socket mode, using driver: sho
[Init Molecule] Operating in non-socket mode, using driver: sho
[Init Molecule] Operating in non-socket mode, using driver: sho
[Init Molecule] Operating in non-socket mode, using driver: sho
[Init Molecule] Operating in non-socket mode, using driver: sho
[Init Molecule] Operating in non-socket mode, using driver: sho
[Init Molecule] Operating in non-socket mode, using driver: sho
[Init Molecule] Operating in non-socket mode, using driver: sho
[Init Molecule] Operating in non-socket mode, using driver: sho
[Init Molecule] Operating in non-socket mode, using driver: sho
[Init Molecule] Operating in non-socket mode, using driver: sho
[Init Molecule] Operating in non-socket mode, using driver: sho
[Init Molecule] Operating in non-socket mode, using driver: sho
[Init Molecule] Operating in non-socket mode, using driver: sho
[Init Molecule] Operating in non-socket mode, using driver: sho
[Init Molecule] Operating in non-socket mode, using driver: sho
[Init Molecule] Operating in non-socket mode, using driver: sho
[Init Molecule] Operating in non-socket mode, using driver: sho
[Init Molecule] Operating in non-socket mode, using driver: sho
[Init Molecule] Operating in non-socket mode, using driver: sho
[Init Molecule] Operating in non-socket mode, using driver: sho
[Init Molecule] Operating in non-socket mode, using driver: sho
[Init Molecule] Operating in non-socket mode, using driver: sho
[Init Molecule] Operating in non-socket mode, using driver: sho
[Init Molecule] Operating in non-socket mode, using driver: sho
[Init Molecule] Operating in non-socket mode, using driver: sho
[Init Molecule] Operating in non-socket mode, using driver: sho
[Init Molecule] Operating in non-socket mode, using driver: sho
[Init Molecule] Operating in non-socket mode, using driver: sho
[Init Molecule] Operating in non-socket mode, using driver: sho
[Init Molecule] Operating in non-socket mode, using driver: sho
[Init Molecule] Operating in non-socket mode, using driver: sho
[Init Molecule] Operating in non-socket mode, using driver: sho
[Init Molecule] Operating in non-socket mode, using driver: sho
[Init Molecule] Operating in non-socket mode, using driver: sho
[Init Molecule] Operating in non-socket mode, using driver: sho
[Init Molecule] Operating in non-socket mode, using driver: sho
[Init Molecule] Operating in non-socket mode, using driver: sho
[Init Molecule] Operating in non-socket mode, using driver: sho
[Init Molecule] Operating in non-socket mode, using driver: sho
[Init Molecule] Operating in non-socket mode, using driver: sho
[Init Molecule] Operating in non-socket mode, using driver: sho
[Init Molecule] Operating in non-socket mode, using driver: sho
[Init Molecule] Operating in non-socket mode, using driver: sho
[Init Molecule] Operating in non-socket mode, using driver: sho
[Init Molecule] Operating in non-socket mode, using driver: sho
[Init Molecule] Operating in non-socket mode, using driver: sho
[Init Molecule] Operating in non-socket mode, using driver: sho
[Init Molecule] Operating in non-socket mode, using driver: sho
[Init Molecule] Operating in non-socket mode, using driver: sho
[Init Molecule] Operating in non-socket mode, using driver: sho
[Init Molecule] Operating in non-socket mode, using driver: sho
[Init Molecule] Operating in non-socket mode, using driver: sho
[Init Molecule] Operating in non-socket mode, using driver: sho
[Init Molecule] Operating in non-socket mode, using driver: sho
[Init Molecule] Operating in non-socket mode, using driver: sho
[Init Molecule] Operating in non-socket mode, using driver: sho
[Init Molecule] Operating in non-socket mode, using driver: sho
[Init Molecule] Operating in non-socket mode, using driver: sho
[Init Molecule] Operating in non-socket mode, using driver: sho
[Init Molecule] Operating in non-socket mode, using driver: sho
[Init Molecule] Operating in non-socket mode, using driver: sho
[Init Molecule] Operating in non-socket mode, using driver: sho
[Init Molecule] Operating in non-socket mode, using driver: sho
[Init Molecule] Operating in non-socket mode, using driver: sho
[Init Molecule] Operating in non-socket mode, using driver: sho
[Init Molecule] Operating in non-socket mode, using driver: sho
[Init Molecule] Operating in non-socket mode, using driver: sho
[Init Molecule] Operating in non-socket mode, using driver: sho
[Init Molecule] Operating in non-socket mode, using driver: sho
[Init Molecule] Operating in non-socket mode, using driver: sho
[Init Molecule] Operating in non-socket mode, using driver: sho
[Init Molecule] Operating in non-socket mode, using driver: sho
[Init Molecule] Operating in non-socket mode, using driver: sho
[Init Molecule] Operating in non-socket mode, using driver: sho
[Init Molecule] Operating in non-socket mode, using driver: sho
[Init Molecule] Operating in non-socket mode, using driver: sho
[Init Molecule] Operating in non-socket mode, using driver: sho
[Init Molecule] Operating in non-socket mode, using driver: sho
[Init Molecule] Operating in non-socket mode, using driver: sho
[Init Molecule] Operating in non-socket mode, using driver: sho
[Init Molecule] Operating in non-socket mode, using driver: sho
[Init Molecule] Operating in non-socket mode, using driver: sho
[Init Molecule] Operating in non-socket mode, using driver: sho
[Init Molecule] Operating in non-socket mode, using driver: sho
[Init Molecule] Operating in non-socket mode, using driver: sho
[Init Molecule] Operating in non-socket mode, using driver: sho
[Init Molecule] Operating in non-socket mode, using driver: sho
[Init Molecule] Operating in non-socket mode, using driver: sho
[Init Molecule] Operating in non-socket mode, using driver: sho
[Init Molecule] Operating in non-socket mode, using driver: sho
[Init Molecule] Operating in non-socket mode, using driver: sho
[Init Molecule] Operating in non-socket mode, using driver: sho
[Init Molecule] Operating in non-socket mode, using driver: sho
[Init Molecule] Operating in non-socket mode, using driver: sho
[Init Molecule] Operating in non-socket mode, using driver: sho
[Init Molecule] Operating in non-socket mode, using driver: sho
[Init Molecule] Operating in non-socket mode, using driver: sho
[Init Molecule] Operating in non-socket mode, using driver: sho
[Init Molecule] Operating in non-socket mode, using driver: sho
[Init Molecule] Operating in non-socket mode, using driver: sho
[Init Molecule] Operating in non-socket mode, using driver: sho
[Init Molecule] Operating in non-socket mode, using driver: sho
[Init Molecule] Operating in non-socket mode, using driver: sho
[Init Molecule] Operating in non-socket mode, using driver: sho
[Init Molecule] Operating in non-socket mode, using driver: sho
[Init Molecule] Operating in non-socket mode, using driver: sho
[Init Molecule] Operating in non-socket mode, using driver: sho
[Init Molecule] Operating in non-socket mode, using driver: sho
[Init Molecule] Operating in non-socket mode, using driver: sho
[Init Molecule] Operating in non-socket mode, using driver: sho
[Init Molecule] Operating in non-socket mode, using driver: sho
[Init Molecule] Operating in non-socket mode, using driver: sho
[Init Molecule] Operating in non-socket mode, using driver: sho
[Init Molecule] Operating in non-socket mode, using driver: sho
[Init Molecule] Operating in non-socket mode, using driver: sho
[Init Molecule] Operating in non-socket mode, using driver: sho
[Init Molecule] Operating in non-socket mode, using driver: sho
[Init Molecule] Operating in non-socket mode, using driver: sho
[Init Molecule] Operating in non-socket mode, using driver: sho
[Init Molecule] Operating in non-socket mode, using driver: sho
[Init Molecule] Operating in non-socket mode, using driver: sho
[Init Molecule] Operating in non-socket mode, using driver: sho
[Init Molecule] Operating in non-socket mode, using driver: sho
[Init Molecule] Operating in non-socket mode, using driver: sho
[Init Molecule] Operating in non-socket mode, using driver: sho
[Init Molecule] Operating in non-socket mode, using driver: sho
[Init Molecule] Operating in non-socket mode, using driver: sho
[Init Molecule] Operating in non-socket mode, using driver: sho
[Init Molecule] Operating in non-socket mode, using driver: sho
[Init Molecule] Operating in non-socket mode, using driver: sho
[Init Molecule] Operating in non-socket mode, using driver: sho
[Init Molecule] Operating in non-socket mode, using driver: sho
[Init Molecule] Operating in non-socket mode, using driver: sho
[Init Molecule] Operating in non-socket mode, using driver: sho
[Init Molecule] Operating in non-socket mode, using driver: sho
[Init Molecule] Operating in non-socket mode, using driver: sho
[Init Molecule] Operating in non-socket mode, using driver: sho
[Init Molecule] Operating in non-socket mode, using driver: sho
[Init Molecule] Operating in non-socket mode, using driver: sho
[Init Molecule] Operating in non-socket mode, using driver: sho
[Init Molecule] Operating in non-socket mode, using driver: sho
[Init Molecule] Operating in non-socket mode, using driver: sho
[Init Molecule] Operating in non-socket mode, using driver: sho
[Init Molecule] Operating in non-socket mode, using driver: sho
[Init Molecule] Operating in non-socket mode, using driver: sho
[Init Molecule] Operating in non-socket mode, using driver: sho
[Init Molecule] Operating in non-socket mode, using driver: sho
[Init Molecule] Operating in non-socket mode, using driver: sho
[Init Molecule] Operating in non-socket mode, using driver: sho
[Init Molecule] Operating in non-socket mode, using driver: sho
[Init Molecule] Operating in non-socket mode, using driver: sho
[Init Molecule] Operating in non-socket mode, using driver: sho
[Init Molecule] Operating in non-socket mode, using driver: sho
[Init Molecule] Operating in non-socket mode, using driver: sho
[Init Molecule] Operating in non-socket mode, using driver: sho
[Init Molecule] Operating in non-socket mode, using driver: sho
[Init Molecule] Operating in non-socket mode, using driver: sho
[Init Molecule] Operating in non-socket mode, using driver: sho
[Init Molecule] Operating in non-socket mode, using driver: sho
[Init Molecule] Operating in non-socket mode, using driver: sho
[Init Molecule] Operating in non-socket mode, using driver: sho
[Init Molecule] Operating in non-socket mode, using driver: sho
[Init Molecule] Operating in non-socket mode, using driver: sho
[Init Molecule] Operating in non-socket mode, using driver: sho
[Init Molecule] Operating in non-socket mode, using driver: sho
[Init Molecule] Operating in non-socket mode, using driver: sho
[Init Molecule] Operating in non-socket mode, using driver: sho
[Init Molecule] Operating in non-socket mode, using driver: sho
[Init Molecule] Operating in non-socket mode, using driver: sho
[Init Molecule] Operating in non-socket mode, using driver: sho
[Init Molecule] Operating in non-socket mode, using driver: sho
[Init Molecule] Operating in non-socket mode, using driver: sho
[Init Molecule] Operating in non-socket mode, using driver: sho
[Init Molecule] Operating in non-socket mode, using driver: sho
[Init Molecule] Operating in non-socket mode, using driver: sho
[Init Molecule] Operating in non-socket mode, using driver: sho
[Init Molecule] Operating in non-socket mode, using driver: sho
[Init Molecule] Operating in non-socket mode, using driver: sho
[Init Molecule] Operating in non-socket mode, using driver: sho
[Init Molecule] Operating in non-socket mode, using driver: sho
[Init Molecule] Operating in non-socket mode, using driver: sho
[Init Molecule] Operating in non-socket mode, using driver: sho
[Init Molecule] Operating in non-socket mode, using driver: sho
[Init Molecule] Operating in non-socket mode, using driver: sho
[Init Molecule] Operating in non-socket mode, using driver: sho
[Init Molecule] Operating in non-socket mode, using driver: sho
[Init Molecule] Operating in non-socket mode, using driver: sho
[Init Molecule] Operating in non-socket mode, using driver: sho
[Init Molecule] Operating in non-socket mode, using driver: sho
[Init Molecule] Operating in non-socket mode, using driver: sho
[Init Molecule] Operating in non-socket mode, using driver: sho
[Init Molecule] Operating in non-socket mode, using driver: sho
[Init Molecule] Operating in non-socket mode, using driver: sho
[Init Molecule] Operating in non-socket mode, using driver: sho
[Init Molecule] Operating in non-socket mode, using driver: sho
[Init Molecule] Operating in non-socket mode, using driver: sho
[Init Molecule] Operating in non-socket mode, using driver: sho
[Init Molecule] Operating in non-socket mode, using driver: sho
[Init Molecule] Operating in non-socket mode, using driver: sho
[Init Molecule] Operating in non-socket mode, using driver: sho
[Init Molecule] Operating in non-socket mode, using driver: sho
[Init Molecule] Operating in non-socket mode, using driver: sho
[Init Molecule] Operating in non-socket mode, using driver: sho
[Init Molecule] Operating in non-socket mode, using driver: sho
[Init Molecule] Operating in non-socket mode, using driver: sho
[Init Molecule] Operating in non-socket mode, using driver: sho
[Init Molecule] Operating in non-socket mode, using driver: sho
[Init Molecule] Operating in non-socket mode, using driver: sho
[Init Molecule] Operating in non-socket mode, using driver: sho
[Init Molecule] Operating in non-socket mode, using driver: sho
[Init Molecule] Operating in non-socket mode, using driver: sho
[Init Molecule] Operating in non-socket mode, using driver: sho
[Init Molecule] Operating in non-socket mode, using driver: sho
[Init Molecule] Operating in non-socket mode, using driver: sho
[Init Molecule] Operating in non-socket mode, using driver: sho
[Init Molecule] Operating in non-socket mode, using driver: sho
[Init Molecule] Operating in non-socket mode, using driver: sho
[Init Molecule] Operating in non-socket mode, using driver: sho
[Init Molecule] Operating in non-socket mode, using driver: sho
[Init Molecule] Operating in non-socket mode, using driver: sho
[Init Molecule] Operating in non-socket mode, using driver: sho
[Init Molecule] Operating in non-socket mode, using driver: sho
[Init Molecule] Operating in non-socket mode, using driver: sho
[Init Molecule] Operating in non-socket mode, using driver: sho
[Init Molecule] Operating in non-socket mode, using driver: sho
[Init Molecule] Operating in non-socket mode, using driver: sho
[Init Molecule] Operating in non-socket mode, using driver: sho
[Init Molecule] Operating in non-socket mode, using driver: sho
[Init Molecule] Operating in non-socket mode, using driver: sho
[Init Molecule] Operating in non-socket mode, using driver: sho
[Init Molecule] Operating in non-socket mode, using driver: sho
[Init Molecule] Operating in non-socket mode, using driver: sho
[Init Molecule] Operating in non-socket mode, using driver: sho
[Init Molecule] Operating in non-socket mode, using driver: sho
[Init Molecule] Operating in non-socket mode, using driver: sho
[Init Molecule] Operating in non-socket mode, using driver: sho
[Init Molecule] Operating in non-socket mode, using driver: sho
[Init Molecule] Operating in non-socket mode, using driver: sho
[Init Molecule] Operating in non-socket mode, using driver: sho
[Init Molecule] Operating in non-socket mode, using driver: sho
[Init Molecule] Operating in non-socket mode, using driver: sho
[Init Molecule] Operating in non-socket mode, using driver: sho
[Init Molecule] Operating in non-socket mode, using driver: sho
[Init Molecule] Operating in non-socket mode, using driver: sho
[Init Molecule] Operating in non-socket mode, using driver: sho
[Init Molecule] Operating in non-socket mode, using driver: sho
[Init Molecule] Operating in non-socket mode, using driver: sho
[Init Molecule] Operating in non-socket mode, using driver: sho
[Init Molecule] Operating in non-socket mode, using driver: sho
[Init Molecule] Operating in non-socket mode, using driver: sho
[Init Molecule] Operating in non-socket mode, using driver: sho
[Init Molecule] Operating in non-socket mode, using driver: sho
[Init Molecule] Operating in non-socket mode, using driver: sho
[Init Molecule] Operating in non-socket mode, using driver: sho
[Init Molecule] Operating in non-socket mode, using driver: sho
[Init Molecule] Operating in non-socket mode, using driver: sho
[Init Molecule] Operating in non-socket mode, using driver: sho
[Init Molecule] Operating in non-socket mode, using driver: sho
[Init Molecule] Operating in non-socket mode, using driver: sho
[Init Molecule] Operating in non-socket mode, using driver: sho
[Init Molecule] Operating in non-socket mode, using driver: sho
[Init Molecule] Operating in non-socket mode, using driver: sho
[Init Molecule] Operating in non-socket mode, using driver: sho
[Init Molecule] Operating in non-socket mode, using driver: sho
[Init Molecule] Operating in non-socket mode, using driver: sho
[Init Molecule] Operating in non-socket mode, using driver: sho
[Init Molecule] Operating in non-socket mode, using driver: sho
[Init Molecule] Operating in non-socket mode, using driver: sho
[Init Molecule] Operating in non-socket mode, using driver: sho
[Init Molecule] Operating in non-socket mode, using driver: sho
[Init Molecule] Operating in non-socket mode, using driver: sho
[Init Molecule] Operating in non-socket mode, using driver: sho
[Init Molecule] Operating in non-socket mode, using driver: sho
[Init Molecule] Operating in non-socket mode, using driver: sho
[Init Molecule] Operating in non-socket mode, using driver: sho
[Init Molecule] Operating in non-socket mode, using driver: sho
[Init Molecule] Operating in non-socket mode, using driver: sho
[Init Molecule] Operating in non-socket mode, using driver: sho
[Init Molecule] Operating in non-socket mode, using driver: sho
[Init Molecule] Operating in non-socket mode, using driver: sho
[Init Molecule] Operating in non-socket mode, using driver: sho
[Init Molecule] Operating in non-socket mode, using driver: sho
[Init Molecule] Operating in non-socket mode, using driver: sho
[Init Molecule] Operating in non-socket mode, using driver: sho
[Init Molecule] Operating in non-socket mode, using driver: sho
[Init Molecule] Operating in non-socket mode, using driver: sho
[Init Molecule] Operating in non-socket mode, using driver: sho
[Init Molecule] Operating in non-socket mode, using driver: sho
[Init Molecule] Operating in non-socket mode, using driver: sho
[Init Molecule] Operating in non-socket mode, using driver: sho
[Init Molecule] Operating in non-socket mode, using driver: sho
[Init Molecule] Operating in non-socket mode, using driver: sho
[Init Molecule] Operating in non-socket mode, using driver: sho
[Init Molecule] Operating in non-socket mode, using driver: sho
[Init Molecule] Operating in non-socket mode, using driver: sho
[Init Molecule] Operating in non-socket mode, using driver: sho
[Init Molecule] Operating in non-socket mode, using driver: sho
[Init Molecule] Operating in non-socket mode, using driver: sho
[Init Molecule] Operating in non-socket mode, using driver: sho
[Init Molecule] Operating in non-socket mode, using driver: sho
[Init Molecule] Operating in non-socket mode, using driver: sho
[Init Molecule] Operating in non-socket mode, using driver: sho
[Init Molecule] Operating in non-socket mode, using driver: sho
[Init Molecule] Operating in non-socket mode, using driver: sho
[Init Molecule] Operating in non-socket mode, using driver: sho
[Init Molecule] Operating in non-socket mode, using driver: sho
[Init Molecule] Operating in non-socket mode, using driver: sho
[Init Molecule] Operating in non-socket mode, using driver: sho
[Init Molecule] Operating in non-socket mode, using driver: sho
[Init Molecule] Operating in non-socket mode, using driver: sho
[Init Molecule] Operating in non-socket mode, using driver: sho
[Init Molecule] Operating in non-socket mode, using driver: sho
[Init Molecule] Operating in non-socket mode, using driver: sho
[Init Molecule] Operating in non-socket mode, using driver: sho
[Init Molecule] Operating in non-socket mode, using driver: sho
[Init Molecule] Operating in non-socket mode, using driver: sho
[Init Molecule] Operating in non-socket mode, using driver: sho
[Init Molecule] Operating in non-socket mode, using driver: sho
[Init Molecule] Operating in non-socket mode, using driver: sho
[Init Molecule] Operating in non-socket mode, using driver: sho
[Init Molecule] Operating in non-socket mode, using driver: sho
[Init Molecule] Operating in non-socket mode, using driver: sho
[Init Molecule] Operating in non-socket mode, using driver: sho
[Init Molecule] Operating in non-socket mode, using driver: sho
[Init Molecule] Operating in non-socket mode, using driver: sho
[Init Molecule] Operating in non-socket mode, using driver: sho
[Init Molecule] Operating in non-socket mode, using driver: sho
[Init Molecule] Operating in non-socket mode, using driver: sho
[Init Molecule] Operating in non-socket mode, using driver: sho
[Init Molecule] Operating in non-socket mode, using driver: sho
[Init Molecule] Operating in non-socket mode, using driver: sho
[Init Molecule] Operating in non-socket mode, using driver: sho
[Init Molecule] Operating in non-socket mode, using driver: sho
[Init Molecule] Operating in non-socket mode, using driver: sho
[Init Molecule] Operating in non-socket mode, using driver: sho
[Init Molecule] Operating in non-socket mode, using driver: sho
[Init Molecule] Operating in non-socket mode, using driver: sho
[Init Molecule] Operating in non-socket mode, using driver: sho
[Init Molecule] Operating in non-socket mode, using driver: sho
[Init Molecule] Operating in non-socket mode, using driver: sho
[Init Molecule] Operating in non-socket mode, using driver: sho
[Init Molecule] Operating in non-socket mode, using driver: sho
[Init Molecule] Operating in non-socket mode, using driver: sho
[Init Molecule] Operating in non-socket mode, using driver: sho
[Init Molecule] Operating in non-socket mode, using driver: sho
[Init Molecule] Operating in non-socket mode, using driver: sho
[Init Molecule] Operating in non-socket mode, using driver: sho
[Init Molecule] Operating in non-socket mode, using driver: sho
[Init Molecule] Operating in non-socket mode, using driver: sho
[Init Molecule] Operating in non-socket mode, using driver: sho
[Init Molecule] Operating in non-socket mode, using driver: sho
[Init Molecule] Operating in non-socket mode, using driver: sho
[Init Molecule] Operating in non-socket mode, using driver: sho
[Init Molecule] Operating in non-socket mode, using driver: sho
[Init Molecule] Operating in non-socket mode, using driver: sho
[Init Molecule] Operating in non-socket mode, using driver: sho
[Init Molecule] Operating in non-socket mode, using driver: sho
[Init Molecule] Operating in non-socket mode, using driver: sho
[Init Molecule] Operating in non-socket mode, using driver: sho
[Init Molecule] Operating in non-socket mode, using driver: sho
[Init Molecule] Operating in non-socket mode, using driver: sho
[Init Molecule] Operating in non-socket mode, using driver: sho
[Init Molecule] Operating in non-socket mode, using driver: sho
[Init Molecule] Operating in non-socket mode, using driver: sho
[Init Molecule] Operating in non-socket mode, using driver: sho
[Init Molecule] Operating in non-socket mode, using driver: sho
[Init Molecule] Operating in non-socket mode, using driver: sho
[Init Molecule] Operating in non-socket mode, using driver: sho
[Init Molecule] Operating in non-socket mode, using driver: sho
[Init Molecule] Operating in non-socket mode, using driver: sho
[Init Molecule] Operating in non-socket mode, using driver: sho
[Init Molecule] Operating in non-socket mode, using driver: sho
[Init Molecule] Operating in non-socket mode, using driver: sho
[Init Molecule] Operating in non-socket mode, using driver: sho
[Init Molecule] Operating in non-socket mode, using driver: sho
[Init Molecule] Operating in non-socket mode, using driver: sho
[Init Molecule] Operating in non-socket mode, using driver: sho
[Init Molecule] Operating in non-socket mode, using driver: sho
[Init Molecule] Operating in non-socket mode, using driver: sho
[Init Molecule] Operating in non-socket mode, using driver: sho
[Init Molecule] Operating in non-socket mode, using driver: sho
[Init Molecule] Operating in non-socket mode, using driver: sho
[Init Molecule] Operating in non-socket mode, using driver: sho
[Init Molecule] Operating in non-socket mode, using driver: sho
[Init Molecule] Operating in non-socket mode, using driver: sho
[Init Molecule] Operating in non-socket mode, using driver: sho
[Init Molecule] Operating in non-socket mode, using driver: sho
[Init Molecule] Operating in non-socket mode, using driver: sho
[Init Molecule] Operating in non-socket mode, using driver: sho
[Init Molecule] Operating in non-socket mode, using driver: sho
[Init Molecule] Operating in non-socket mode, using driver: sho
[Init Molecule] Operating in non-socket mode, using driver: sho
[Init Molecule] Operating in non-socket mode, using driver: sho
[Init Molecule] Operating in non-socket mode, using driver: sho
[Init Molecule] Operating in non-socket mode, using driver: sho
[Init Molecule] Operating in non-socket mode, using driver: sho
[Init Molecule] Operating in non-socket mode, using driver: sho
[Init Molecule] Operating in non-socket mode, using driver: sho
[Init Molecule] Operating in non-socket mode, using driver: sho
[Init Molecule] Operating in non-socket mode, using driver: sho
[Init Molecule] Operating in non-socket mode, using driver: sho
[Init Molecule] Operating in non-socket mode, using driver: sho
[Init Molecule] Operating in non-socket mode, using driver: sho
[Init Molecule] Operating in non-socket mode, using driver: sho
[Init Molecule] Operating in non-socket mode, using driver: sho
[Init Molecule] Operating in non-socket mode, using driver: sho
[Init Molecule] Operating in non-socket mode, using driver: sho
[Init Molecule] Operating in non-socket mode, using driver: sho
[Init Molecule] Operating in non-socket mode, using driver: sho
[Init Molecule] Operating in non-socket mode, using driver: sho
[Init Molecule] Operating in non-socket mode, using driver: sho
[Init Molecule] Operating in non-socket mode, using driver: sho
[Init Molecule] Operating in non-socket mode, using driver: sho
[Init Molecule] Operating in non-socket mode, using driver: sho
[Init Molecule] Operating in non-socket mode, using driver: sho
[Init Molecule] Operating in non-socket mode, using driver: sho
[Init Molecule] Operating in non-socket mode, using driver: sho
[Init Molecule] Operating in non-socket mode, using driver: sho
[Init Molecule] Operating in non-socket mode, using driver: sho
[Init Molecule] Operating in non-socket mode, using driver: sho
[Init Molecule] Operating in non-socket mode, using driver: sho
[Init Molecule] Operating in non-socket mode, using driver: sho
[Init Molecule] Operating in non-socket mode, using driver: sho
[Init Molecule] Operating in non-socket mode, using driver: sho
[Init Molecule] Operating in non-socket mode, using driver: sho
[MultiModeCavity] omega_parallel in cm-1 [  70.71067812  111.80339887  158.11388301 ... 2475.88368063 2510.47804213
 2545.58441227]
[MultiModeCavity] omega_k in cm-1 [2321.07733607 2322.69240323 2325.3816891  ... 3392.99277924 3418.31829998
 3444.18350266]
[MultiModeCavity] smooth_x:
 [0.         0.24754204 0.92464105 1.         1.         1.
 1.         1.         1.         1.         1.         1.
 1.         1.         1.         1.         1.         1.
 1.         1.         1.         1.         1.         1.
 1.         1.         1.         1.         1.         1.
 1.         1.         1.         0.92464105 0.24754204 0.        ]
[MultiModeCavity] smooth_y:
 [0.         0.24754204 0.92464105 1.         1.         1.
 1.         1.         1.         1.         1.         1.
 1.         1.         1.         1.         1.         1.
 1.         1.         1.         1.         1.         1.
 1.         1.         1.         1.         1.         1.
 1.         1.         1.         0.92464105 0.24754204 0.        ]
[MultiModeCavity] Applying Absorbing Boundary Condition: True, cutoff: [0.1, 0.1]
[LangevinThermostat] NVT thermostat enabled with T = 300.0 K = 0.0009500434689 a.u., Langevin tau = 5000.0 fs = 206706.866675 a.u.
[Maxwell-Boltzmann Initializer] Initializing positions with Maxwell-Boltzmann distribution at temperature 0.0009500434689 au.
[Maxwell-Boltzmann Initializer] Initializing momenta with Maxwell-Boltzmann distribution at temperature 0.0009500434689 au.
[MultiModeCavity] Recording history: True, to disk: False, record_every_steps: 40, record_max_steps: 77
[MultiModeCavity] Recording fields : none
[MultiModeCavity] Recording address: N/A, filename: N/A
[MultiModeCavity] Temporary folder : N/A
[MultiModeCavity] Completed 1000/3042 [32.9%] steps, time/step: 4.84e-03 seconds, remaining time: 9.89 seconds.
[MultiModeCavity] Completed 2000/3042 [65.7%] steps, time/step: 4.84e-03 seconds, remaining time: 5.04 seconds.
[MultiModeCavity] Completed 3000/3042 [98.6%] steps, time/step: 4.86e-03 seconds, remaining time: 0.20 seconds.
Finally, let’s view the time-resolved EM field dynamics due to the pulse.
Note that as here we only have a single SHO for each grid point, the EM field experiences no dephasing, and the UP keeps transport ballistically.
If realistic molecular drivers at condensed phases, such as LAMMPS MD engines, are used instead, ballistic to diffusive turnover of the UP transport will emerge.
[5]:
fig, axes = plt.subplots(1,3, figsize=(12,4))
time_list = [10, 38, 75]
time_labels = [r"$t=%.1f$ ps" % (t/50) for t in time_list]
data = np.abs(np.array(sim.effective_efield_history)[:,:,1].reshape(-1, 36, 36))**2
vmax = np.max(np.max(data[time_list[0],:,:]))
vmin = vmax * 0.005
for y0 in range(3):
    sp = (np.abs(data[time_list[y0], :]).reshape(36, 36))**2
    extent = [0 , 36, 0, 36]
    pos = axes[y0].imshow(sp, aspect='equal', extent=extent, origin="lower",
            cmap=cm.hot, interpolation='nearest',
            norm=LogNorm(vmin=vmin, vmax=vmax))
    axes[y0].set_box_aspect(1)
    axes[y0].set_yticks([0,18,36])
    axes[y0].set_yticklabels([r"$0$", r"$50$", r"$100$"])
    axes[y0].set_xticks([0,18,36])
    axes[y0].set_xticklabels([r"$0$", r"$50$", r"$100$"])
    axes[y0].text(0.05, 0.18, time_labels[y0], transform=axes[y0].transAxes, fontsize=12, fontweight='bold', va='top', ha='left', color="w")
    axes[y0].set_xlabel(r"$L_x$ position [$\mu\rm{m}$]", fontsize=12)
    if y0 == 0: axes[y0].set_ylabel(r"$L_y$ position [$\mu\rm{m}$]", fontsize=12)

    if y0 == 2:
        cbar_ax = axes[y0].inset_axes([1.04, 0.0, 0.055, 1.0])
        cbar = fig.colorbar(pos, cax=cbar_ax)
        cbar.ax.tick_params(labelsize=12)
        cbar.set_label("E-field intensity [a.u.]", fontsize=12)

for j in range(3):
    axes[j].text(0.05, 0.95, r"$k_{\parallel} \ =$"+rf"$ \ 450 \ $"+r"$\rm{cm}^{-1}$", transform=axes[j].transAxes, fontsize=12, fontweight='bold', va='top', ha='left', color="w")
    axes[j].text(0.05, 0.85, r"$W_{\rm ph}=$"+rf"$ \ 0.61 \ $", transform=axes[j].transAxes, fontsize=12, fontweight='bold', va='top', ha='left', color="w")